

 May 27 2022, 06:30 AM

QUOTE(genesic @ May 26 2022, 10:56 PM)
just notice that i can filter out the Net deposit or current value from the TOTAL INVESTMENT SUMMARY graph.
but why is there a bump showing the current value increase and drop back as below ?
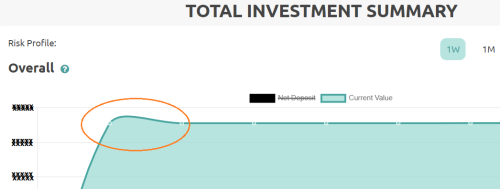

looks pretty but useless smooth-line chart --- bad use of chartbut why is there a bump showing the current value increase and drop back as below ?
the algorithm to smoothen the chart will create misleading bump or dip.
straight line is always better to show exact value over time.
 Quote
Quote


 0.0243sec
 0.49
0.49
 6 queries
 GZIP Disabled