Outline ·
[ Standard ] ·
Linear+
Investment StashAway Malaysia, Multi-Region ETF at your fingertips!
|
honsiong
|
 Jun 2 2021, 05:29 PM Jun 2 2021, 05:29 PM
|

|
QUOTE(Hoshiyuu @ Jun 1 2021, 01:32 PM) Oh, right, wanted to share something. I made a portfolio during my initial registration that I only put in RM500 once so I have easy access to the "trend" of the risk portfolio. Here's how it looks 3 months in. 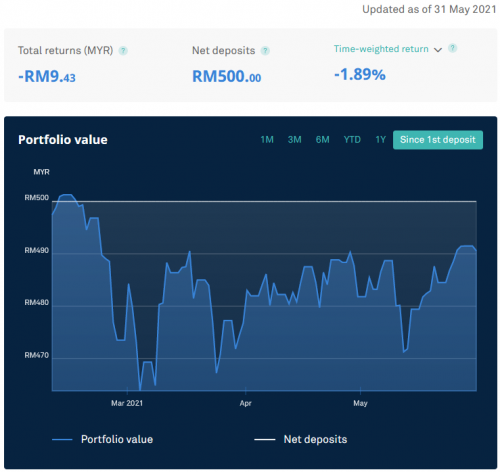 And a quick update on the daily "DCA" meme portfolio. After switching to RM20 a day, I noticed it'll happily deposit 3-4 days consecutively a week, then choke for 2-3 days on the weekend. The buy-days is pretty consistent @ RM20, so I think the ~$5 purchase theory might still be true. I am loving the bumpy line so much! 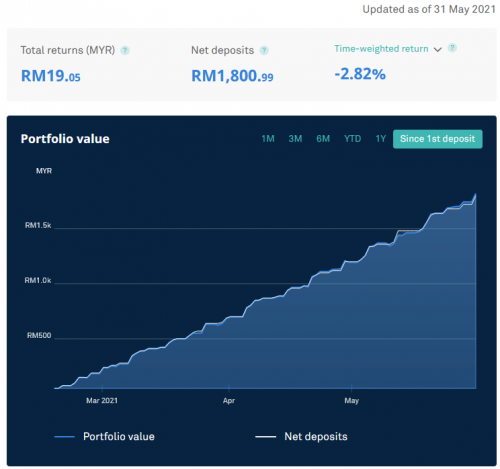 Both pictures are 36% Edit: normal boring weekly DCA stair steps chart for comparison  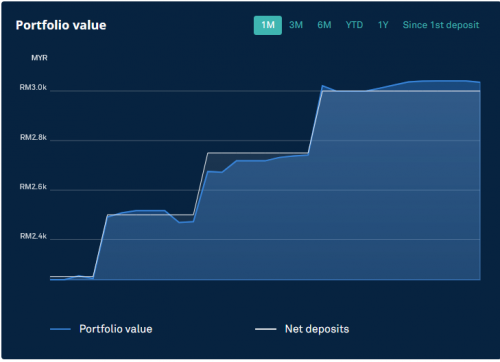 QUOTE(jacksonpang @ Jun 1 2021, 01:48 PM) you should be glad you're in positive TWR.. lol.. mine is SRI 36%.  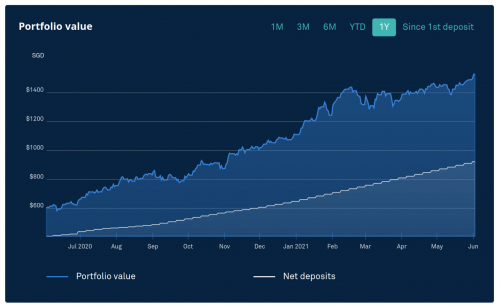 Kesian nya, see my portfolio value far above net deposits. All you need is hodl and DCA. |
|
|
|
|
|
zeronuker
|
Jun 2 2021, 05:34 PM
|
Getting Started

|
QUOTE(honsiong @ Jun 2 2021, 05:29 PM) Kesian nya, see my portfolio value far above net deposits. All you need is hodl and DCA. How long you hodl and DCA? |
|
|
|
|
|
honsiong
|
Jun 2 2021, 05:35 PM
|
|
|
QUOTE(zeronuker @ Jun 2 2021, 05:34 PM) How long you hodl and DCA? Since August 2017, not a perfect DCA coz I was a fresh grad worker and I spent a lot on travelling + take unpaid leave. |
|
|
|
|
|
zeronuker
|
Jun 2 2021, 05:37 PM
|
Getting Started
|
QUOTE(honsiong @ Jun 2 2021, 05:35 PM) Since August 2017, not a perfect DCA coz I was a fresh grad worker and I spent a lot on travelling + take unpaid leave. Not bad at all. Here's hoping my hodl and DCA works out as well |
|
|
|
|
|
elea88
|
Jun 2 2021, 08:28 PM
|
|
|
QUOTE(honsiong @ Jun 2 2021, 05:29 PM) Kesian nya, see my portfolio value far above net deposits. All you need is hodl and DCA. how to switch 20 a day? i cannot find it |
|
|
|
|
|
SUSxander83
|
Jun 2 2021, 08:52 PM
|
|
|
QUOTE(honsiong @ Jun 2 2021, 05:29 PM) Kesian nya, see my portfolio value far above net deposits. All you need is hodl and DCA. Imagine your account with another 0 the gains would be closed to doubled Question is lump sum and then VCA after monthly dip or still daily DCA? |
|
|
|
|
|
honsiong
|
Jun 2 2021, 11:45 PM
|
|
|
QUOTE(xander83 @ Jun 2 2021, 08:52 PM) Imagine your account with another 0 the gains would be closed to doubled Question is lump sum and then VCA after monthly dip or still daily DCA? Another 0 should mean 10x no? |
|
|
|
|
|
pinksapphire
|
Jun 3 2021, 01:26 AM
|
|
|
QUOTE(honsiong @ Jun 2 2021, 05:29 PM) Kesian nya, see my portfolio value far above net deposits. All you need is hodl and DCA. I can only dream of seeing this graph in mine someday, lol |
|
|
|
|
|
SUSxander83
|
Jun 3 2021, 02:35 AM
|
|
|
QUOTE(honsiong @ Jun 2 2021, 11:45 PM) Another 0 should mean 10x no? Then you can add another 0 to double you’re gain so in year  |
|
|
|
|
|
kelvinfixx
|
Jun 3 2021, 04:18 PM
|
|
|
QUOTE(honsiong @ Jun 2 2021, 05:29 PM) Kesian nya, see my portfolio value far above net deposits. All you need is hodl and DCA. this graph is impressive. |
|
|
|
|
|
tadashi987
|
Jun 3 2021, 06:14 PM
|
|
|
QUOTE(honsiong @ Jun 2 2021, 05:29 PM) Kesian nya, see my portfolio value far above net deposits. All you need is hodl and DCA. wa kasih show since inception TWR and MWR  |
|
|
|
|
|
honsiong
|
Jun 3 2021, 06:23 PM
|
|
|
QUOTE(tadashi987 @ Jun 3 2021, 06:14 PM) wa kasih show since inception TWR and MWR  This is few months ago when KWEB peaked. |
|
|
|
|
|
tadashi987
|
Jun 3 2021, 07:22 PM
|
|
|
QUOTE(honsiong @ Jun 3 2021, 06:23 PM) This is few months ago when KWEB peaked. Can we say SA is outperform even compared to some of mainstream best performing ETF e.g. ARKW, IBUY, SMH  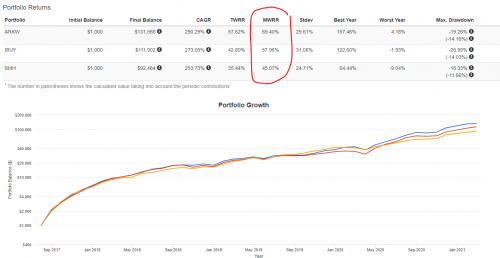 DISCLAIMER, take the comparation with grain of salt: DISCLAIMER, take the comparation with grain of salt: 1. This simulation is backtest generated based on August 2017 to Feb 2021 with initial $1000 and monthly FIXED DCA of %1000. 2. Honsiong might have DCA-ed with different amount at different period of times. 3. I DO NOT assure both platform MWR/MWRR formula are consistent nor I onfirm we should use both platform MWR shown to compare. backtest source i used: https://www.portfoliovisualizer.com/ |
|
|
|
|
|
honsiong
|
Jun 3 2021, 07:33 PM
|
|
|
QUOTE(tadashi987 @ Jun 3 2021, 07:22 PM) Can we say SA is outperform even compared to some of mainstream best performing ETF e.g. ARKW, IBUY, SMH DISCLAIMER, take the comparation with grain of salt: 1. This simulation is backtest generated based on August 2017 to Feb 2021 with initial $1000 and monthly FIXED DCA of %1000. 2. Honsiong might have DCA-ed with different amount at different period of times. 3. I DO NOT assure both platform MWR/MWRR formula are consistent nor I onfirm we should use both platform MWR shown to compare. backtest source i used: https://www.portfoliovisualizer.com/Stashaway TWR and MWR is not annualised, haiz. They don't show annualised returns in app. |
|
|
|
|
|
SUSxander83
|
Jun 3 2021, 09:56 PM
|
|
|
QUOTE(tadashi987 @ Jun 3 2021, 07:22 PM) Can we say SA is outperform even compared to some of mainstream best performing ETF e.g. ARKW, IBUY, SMH DISCLAIMER, take the comparation with grain of salt: 1. This simulation is backtest generated based on August 2017 to Feb 2021 with initial $1000 and monthly FIXED DCA of %1000. 2. Honsiong might have DCA-ed with different amount at different period of times. 3. I DO NOT assure both platform MWR/MWRR formula are consistent nor I onfirm we should use both platform MWR shown to compare. backtest source i used: https://www.portfoliovisualizer.com/Cannot compared because SA has the asset allocation which are only 60% growth portfolio on 36% SRI coupled with defensive sectors and inflation hedge You will be thankful if any year SA can 20%pa as the platform is more asset preservation which highly unlikely will deflate your portfolio ARKW is super growth which is easily 20%+ growth but doesn’t hedge against inflation and susceptible to rising yield hence it is 80% volatility when on market trends |
|
|
|
|
|
tadashi987
|
Jun 3 2021, 10:28 PM
|
|
|
QUOTE(xander83 @ Jun 3 2021, 09:56 PM) Cannot compared because SA has the asset allocation which are only 60% growth portfolio on 36% SRI coupled with defensive sectors and inflation hedge You will be thankful if any year SA can 20%pa as the platform is more asset preservation which highly unlikely will deflate your portfolio ARKW is super growth which is easily 20%+ growth but doesn’t hedge against inflation and susceptible to rising yield hence it is 80% volatility when on market trends yeah needa add a desclaimer it is not asset allocation on par comparison  |
|
|
|
|
|
coldbasecamp
|
Jun 3 2021, 11:54 PM
|
Getting Started
|
my portfolio finally green after many months. I am been investing proceeds from EPF's i-Sinar into Stashaway Core Portfolio.
Hope it outruns EPF return in longer run.
|
|
|
|
|
|
SUSxander83
|
Jun 4 2021, 04:02 AM
|
|
|
QUOTE(tadashi987 @ Jun 3 2021, 10:28 PM) yeah needa add a desclaimer it is not asset allocation on par comparison You should compared apples to apples with single ETFs for better clarity The reason why SA is different because is a basket case of inflation hedge, fixed incomes, bond, defensive and growth play and the weightage 50% of each portfolio are quite stable hence their performance are good for capital preservation in whatever market conditions |
|
|
|
|
|
akhito
|
Jun 4 2021, 08:26 AM
|
|
|
del
edit ald got pm on 0830.
This post has been edited by akhito: Jun 4 2021, 09:29 AM
|
|
|
|
|
|
necrox77
|
Jun 4 2021, 10:59 AM
|
Getting Started
|
Anyone got mail about simple want to change mmf from eastspring to Ami income fund?
|
|
|
|
|


 Quote
Quote


 0.0262sec
 0.32
0.32
 6 queries
 GZIP Disabled