

QUOTE(djhenry91 @ Mar 30 2017, 04:00 PM)
cup maaa thn apa u want wor.


Pretty damn risky to ask me what I want....

BWC
|
|
 Mar 30 2017, 04:08 PM Mar 30 2017, 04:08 PM
|

All Stars
15,942 posts Joined: Jun 2008 |
QUOTE(djhenry91 @ Mar 30 2017, 04:00 PM) cup maaa thn apa u want wor. Pretty damn risky to ask me what I want.... |
|
|
|
|
|
Mar 30 2017, 04:33 PM
|
|
Senior Member
8,653 posts Joined: Sep 2005 From: lolyat |
QUOTE(Boon3 @ Mar 30 2017, 11:24 AM) Basic of cups.... Thank you sifu boon See it's macam this... Hope I can spit everything out clearly. Stocks came down from a high ( dun care the reason la).. So it falls off.... Yes is falling...the VOLUME disappears... (Yeah..for whatever nobody wants to sell anymore)... So you get a period where it goes comatose... After time... The volume and price increases slightly.... People suddenly remember the stock... So it goes back up..... So you get the rounded cup scene... As it inches back up...to where it fell from.... A cup would have formed..... But then.... U will have a bunch of sellers who were merely waiting to sell at a higher price+u got a bunch of low price traders who were munching bits and bits at the bottom ...they decides to sell to take profit..... Now that is the handle formation....... And once these batch of sellers exhaust their selling... The stock would erupt once the new wave of buying happens........ Ideally the cup formation takes about 6-8 months... And too long cup formation isn't ideal either... ie if the cup takes 2 years or longer to form.... Ok ah? This is as much as i can remember off hand.  I think the main criteria is the volume must be convincing for the Cup and Handle |
|
|
Mar 30 2017, 04:45 PM
|
|
All Stars
15,942 posts Joined: Jun 2008 |
QUOTE(yhtan @ Mar 30 2017, 04:33 PM) Thank you sifu boon I think the main criteria is the volume must be convincing for the Cup and Handle   sifut ur head laaaa..... Volume must be there both sides of the cup... middle/center/bottom = almost no volume... then the handle.... how it is FORMED is very important... never buy at the bottom of the handle? Why? You subject yourself to the risk of a failed cup&handle. YES! FAILED PATTERNS are actually more common!!!  Call me the S name again... and I will promote you.... to the ignore list.  |
|
|
Mar 30 2017, 04:57 PM
|
|
Senior Member
8,653 posts Joined: Sep 2005 From: lolyat |
QUOTE(Boon3 @ Mar 30 2017, 04:45 PM) sifut ur head laaaa..... Volume must be there both sides of the cup... middle/center/bottom = almost no volume... then the handle.... how it is FORMED is very important... never buy at the bottom of the handle? Why? You subject yourself to the risk of a failed cup&handle. YES! FAILED PATTERNS are actually more common!!! Call me the S name again... and I will promote you.... to the ignore list. Yes the volume has to be the side, normally trader chase when it breakout with volume surging |
|
|
Mar 30 2017, 05:05 PM
|

Senior Member
6,779 posts Joined: Jan 2009 From: SEGI Heaven |
i remember there is one chart Big cup hide medium cup hide small cup
|
|
|
Mar 30 2017, 05:08 PM
|
|
All Stars
15,942 posts Joined: Jun 2008 |
QUOTE(djhenry91 @ Mar 30 2017, 05:05 PM) i remember there is one chart Big cup hide medium cup hide small cup Macam this sudah cup board laaaaa..... |
|
|
|
|
|
Mar 30 2017, 05:12 PM
|
|
Senior Member
6,779 posts Joined: Jan 2009 From: SEGI Heaven |
QUOTE(Boon3 @ Mar 30 2017, 05:08 PM) Macam this sudah cup board laaaaa..... no la...thn go up like no limit..i mcam see before leh forget which stock |
|
|
Mar 31 2017, 08:36 AM
|
|
All Stars
15,942 posts Joined: Jun 2008 |
» Click to show Spoiler - click again to hide... « TakoC This would have been the chart I was looking at.  Well, upon seeing the chart more clearly, perhaps I SHOULD HAVE mentioned the doji (a bit long its leg) that was formed the previous day. Some would consider this as a trading buy. ... and judging from yesterday's movements... they were correct.  Made money?  |
|
|
Mar 31 2017, 09:30 AM
|
|
Senior Member
6,779 posts Joined: Jan 2009 From: SEGI Heaven |
QUOTE(Boon3 @ Mar 31 2017, 08:36 AM) » Click to show Spoiler - click again to hide... « TakoC This would have been the chart I was looking at. Well, upon seeing the chart more clearly, perhaps I SHOULD HAVE mentioned the doji (a bit long its leg) that was formed the previous day. Some would consider this as a trading buy. ... and judging from yesterday's movements... they were correct. Made money? |
|
|
Mar 31 2017, 09:48 AM
|
|
All Stars
15,942 posts Joined: Jun 2008 |
QUOTE(djhenry91 @ Mar 31 2017, 09:30 AM) tht company is shoplot office wor..beside BKT nearby my house area Ya... there are quite a number of listed companies whose offices aren't impressive looking...and yes... some operates in shop lot offices premises.... makes you wonder hor....  If you would have noted, this should be a turnaround play... and whenever there are turnaround plays... there will be many fansi.... and even I would be aroused occasionally.... but this one... listed in 2012... so fy 2012... usually don't count one la.... those prelisting numbers always fei kei ones.... by fy 2015 .... this bugger already started losing money...  so now fy 2016.... turnaround.... and as you know... market always bet on future earnings one ma.... but this fella... with such a track record.... how to trust deep deep and bet big big?  |
|
|
Mar 31 2017, 10:58 AM
|
|
All Stars
15,942 posts Joined: Jun 2008 |
 From Henry. |
|
|
Mar 31 2017, 11:53 AM
|
|
Senior Member
4,821 posts Joined: Mar 2009 |
any guru wants to discuss this chart?
the last candle captured ard 12pm, not close for the day yet. is it a buy or sell signal based on TA? 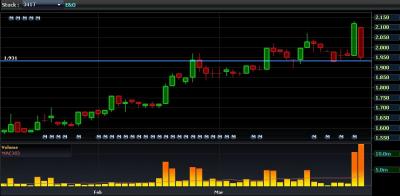
This post has been edited by lowya: Mar 31 2017, 11:54 AM |
|
|
Mar 31 2017, 02:45 PM
|

Senior Member
1,497 posts Joined: Dec 2005 |
That bearish candle with the higher volume looks ugly though
|
|
|
|
|
|
Mar 31 2017, 04:51 PM
|
|
Senior Member
6,779 posts Joined: Jan 2009 From: SEGI Heaven |
QUOTE(Boon3 @ Mar 31 2017, 10:58 AM) From Henry. |
|
|
Mar 31 2017, 05:14 PM
|
|
All Stars
15,942 posts Joined: Jun 2008 |
QUOTE(djhenry91 @ Mar 31 2017, 04:51 PM) bigger cup to medium cup to small cup ?????? which one leh? |
|
|
Mar 31 2017, 07:09 PM
Show posts by this member only | IPv6 | Post
#436
|
|
Senior Member
6,779 posts Joined: Jan 2009 From: SEGI Heaven |
frontkn maaa
|
|
|
Apr 1 2017, 12:19 AM
|

Senior Member
2,081 posts Joined: Mar 2012 |
QUOTE(Boon3 @ Mar 31 2017, 08:36 AM) » Click to show Spoiler - click again to hide... « TakoC This would have been the chart I was looking at. Well, upon seeing the chart more clearly, perhaps I SHOULD HAVE mentioned the doji (a bit long its leg) that was formed the previous day. Some would consider this as a trading buy. ... and judging from yesterday's movements... they were correct. Made money? |
|
|
Apr 1 2017, 12:19 AM
|
|
Senior Member
2,081 posts Joined: Mar 2012 |
QUOTE(lowya @ Mar 31 2017, 11:53 AM) any guru wants to discuss this chart? Hope to get some thought on this too. High profile deal, but price down 9% upon closing.the last candle captured ard 12pm, not close for the day yet. is it a buy or sell signal based on TA?
|
|
|
Apr 1 2017, 09:56 PM
|

Senior Member
12,534 posts Joined: Mar 2009 From: Penang, KL, China, Indonesia.... |
Edit
This post has been edited by gark: Apr 1 2017, 09:57 PM |
|
|
Apr 1 2017, 10:18 PM
|
|
Senior Member
2,906 posts Joined: May 2015 |
Happy April Fools everyone!
Let me fool everyone with a chart that I think has "potential" in the upcoming days, weeks and potentially months. Let us discuss one of my siggy shares, Parkson (and so, the pump and dump activity can continue and people like me can profit! Great plan right? Sure everyone know that this company is a loss-making firm (well who would not thought about it). In the last few years, 5 years or so, it has been on a long term downtrend which if we zoom out of the chart, there is no full stop on this company. Every few or so month, the company's shares will get dragged down for the obvious reasons, their huge mistake in investing into China. Let us look at the recent financial figures and we can see Parkson is profiting once again, albeit so far, up 10 million, down from 31 million of net profits during the same quarter. The net tangible assets as of now stands at RM2.38. But hey, this is a trading topic right? So why the whole talk about fundamentals in here? Bring us to the technical aspect part. So remember that I have said it was down for about 5 years? If one were to argue, "But where got all downtrend? There was at least a stable phase on the one month chart in 2014." But if we were to zoom out to the weekly chart, short term wise, it has been proven a downtrend lagger and it has been nearly 90% since 2011. Embarrassing! However, recently the chart has been stabilised since the start of the year and maintained consistency in 2017. Word abuzz come from privatisation, sale of their retail assets, blah, blah. This is not important. What is important is that, there is recently few upside down dragonfly Doris known as the "gravestone doji" appearing in the Parkson graph. Gravestone dojis usually appear when a bullrun has overran its course. But the weird case is that, it has showing up on the daily chart near the lowest point. Does this mean a bull is picking up again? But anyway, this is just a prank. Have a nice weekend ahead. Apologies for having me to take the pic as Investing.com is not really friendly in sharing links... This post has been edited by ILoveLalat.net: Apr 1 2017, 10:36 PM Attached thumbnail(s) 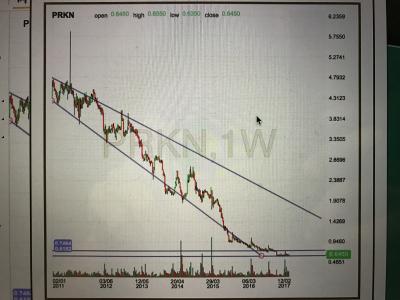
|
| Change to: |  0.0206sec 0.0206sec
 0.65 0.65
 6 queries 6 queries
 GZIP Disabled GZIP Disabled
Time is now: 22nd December 2025 - 08:36 AM |
 Quote
Quote