


This post has been edited by billy_overheat: Mar 13 2021, 09:18 AM
BWC
|
|
 Mar 13 2021, 09:18 AM Mar 13 2021, 09:18 AM
Show posts by this member only | IPv6 | Post
#4261
|

Senior Member
3,373 posts Joined: Nov 2008 |
Has anyone noticed CIMB is forming cup and handle and possible reward from the increase interest rate might make the stock price interesting in the future?
This post has been edited by billy_overheat: Mar 13 2021, 09:18 AM |
|
|
|
|
|
Mar 13 2021, 10:03 AM
|
|
All Stars
15,942 posts Joined: Jun 2008 |
QUOTE(billy_overheat @ Mar 13 2021, 09:18 AM) Has anyone noticed CIMB is forming cup and handle and possible reward from the increase interest rate might make the stock price interesting in the future? No it isn't a CH. And the biggest mistake, which often results in so called pattern failures, is when one assume that a pattern will form. brokenbomb and Syie9^_^ liked this post
|
|
|
Mar 13 2021, 11:06 AM
Show posts by this member only | IPv6 | Post
#4263
|
|
All Stars
15,942 posts Joined: Jun 2008 |
QUOTE(Boon3 @ Mar 13 2021, 10:03 AM) No it isn't a CH. And this is not saying the stock will go up or down.And the biggest mistake, which often results in so called pattern failures, is when one assume that a pattern will form. I'm just saying it's not a cup... |
|
|
Mar 13 2021, 04:02 PM
|
|
Senior Member
3,373 posts Joined: Nov 2008 |
QUOTE(Boon3 @ Mar 13 2021, 11:06 AM) And this is not saying the stock will go up or down. Is it because it's not really a smooth u or is the volume not significantly lower towards the ride side of the chart? I've seen various people drawing different types of c&h. I'm just saying it's not a cup... Yeah, that's what making me confused as well. A lot of seeing what they want to see. Thanks first boon! |
|
|
Mar 15 2021, 09:16 AM
|
|
All Stars
15,942 posts Joined: Jun 2008 |
QUOTE(billy_overheat @ Mar 13 2021, 04:02 PM) Is it because it's not really a smooth u or is the volume not significantly lower towards the ride side of the chart? I've seen various people drawing different types of c&h. Compare the actual definition of what's a CH. It's googable.Yeah, that's what making me confused as well. A lot of seeing what they want to see. Thanks first boon! Then compare it to the chart of CIMB. It's no where close to a CH. Yeah... you really got to be careful with what you read in forums. There's simply way too much BS comments; comments which are twisted cause they want you to buy what they are buying. You don't even have to go i3. Go look at the main stock thread. The amount of BS by a couple of bad hats is totally unreal. Take care..... Spider time.... |
|
|
Mar 15 2021, 11:20 AM
|
|
Senior Member
3,373 posts Joined: Nov 2008 |
QUOTE(Boon3 @ Mar 15 2021, 09:16 AM) Compare the actual definition of what's a CH. It's googable. Then compare it to the chart of CIMB. It's no where close to a CH. Yeah... you really got to be careful with what you read in forums. There's simply way too much BS comments; comments which are twisted cause they want you to buy what they are buying. You don't even have to go i3. Go look at the main stock thread. The amount of BS by a couple of bad hats is totally unreal. Take care..... Spider time.... 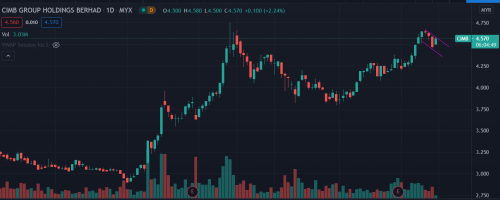 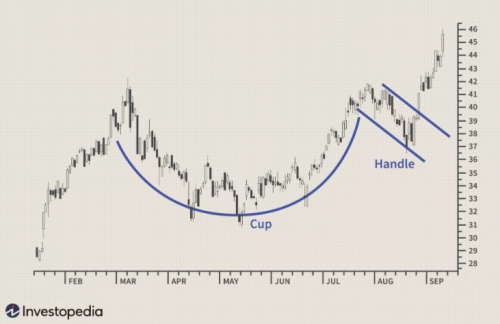 Is it because of the shape of the cup or the handle part which it hasn't properly formed? or is it because of the depth of the cup? 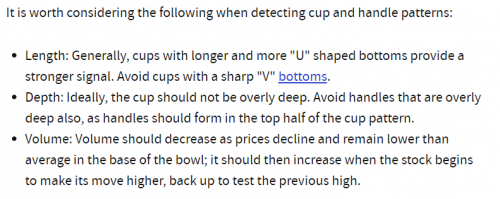 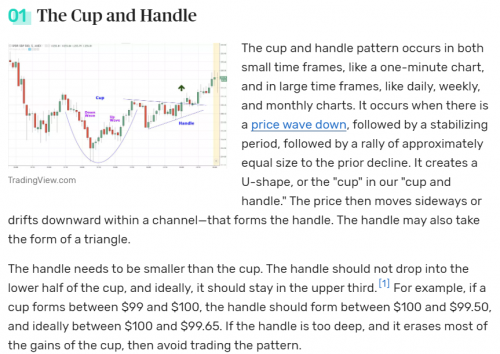 There are quite many different definitions of the chart patterns but I'm more familiar with investopedia. I wonder what is the gold standard of the diffferent chart patterns we've got these days. The creator or the more prominent traders who are more successful using the certain applications? Thanks first for replying, boon.  This post has been edited by billy_overheat: Mar 15 2021, 11:23 AM |
|
|
|
|
|
Mar 15 2021, 03:30 PM
|
|
All Stars
15,942 posts Joined: Jun 2008 |
QUOTE(billy_overheat @ Mar 15 2021, 11:20 AM) Is it because of the shape of the cup or the handle part which it hasn't properly formed? or is it because of the depth of the cup? There are quite many different definitions of the chart patterns but I'm more familiar with investopedia. I wonder what is the gold standard of the diffferent chart patterns we've got these days. The creator or the more prominent traders who are more successful using the certain applications? Thanks first for replying, boon. My eyes not seeing Need to send to fix....... now where did me spider go....  |
|
|
Mar 15 2021, 03:36 PM
|

Senior Member
1,497 posts Joined: Dec 2005 |
Hmm maybe can consider the volume at the end of the cup. The volume is similar to when its making the U shape. So one may not perceive that as a C&H pattern kuaaaaa
|
|
|
Mar 16 2021, 10:28 AM
|
|
Senior Member
3,373 posts Joined: Nov 2008 |
QUOTE(Boon3 @ Mar 15 2021, 03:30 PM) My eyes not seeing Need to send to fix....... now where did me spider go.... welll i'm not sure. gonna research more. btw, apa spider mainn |
|
|
Mar 16 2021, 10:33 AM
|

Senior Member
1,075 posts Joined: Apr 2010 |
i'm also playing with spider now
Oil palm - price high but low production... meh Tech - malaysia tech continue it's correction... meh Gloves - once loved, now everyone shy Oil and gas - with US shale oil. how to pump price to ceiling? Plastic - Resin price eaten up the margin wood and paper - china china steel - not a fan, but i believe demand is just not there banking - not a fan too construction and pretty - i'll avoid at all cost everyone can share or welcome to dispute my statement |
|
|
Mar 16 2021, 03:19 PM
|
|
All Stars
15,942 posts Joined: Jun 2008 |
QUOTE(squarepilot @ Mar 16 2021, 10:33 AM) i'm also playing with spider now go play wif your own spider......................... Oil palm - price high but low production... meh Tech - malaysia tech continue it's correction... meh Gloves - once loved, now everyone shy Oil and gas - with US shale oil. how to pump price to ceiling? Plastic - Resin price eaten up the margin wood and paper - china china steel - not a fan, but i believe demand is just not there banking - not a fan too construction and pretty - i'll avoid at all cost everyone can share or welcome to dispute my statement  |
|
|
Mar 17 2021, 02:56 PM
|
|
Senior Member
567 posts Joined: Feb 2006 |
QUOTE(billy_overheat @ Mar 15 2021, 11:20 AM) Is it because of the shape of the cup or the handle part which it hasn't properly formed? or is it because of the depth of the cup? There are quite many different definitions of the chart patterns but I'm more familiar with investopedia. I wonder what is the gold standard of the diffferent chart patterns we've got these days. The creator or the more prominent traders who are more successful using the certain applications? Thanks first for replying, boon. Don't wanna be buying around this area. Unless there is breakout. This post has been edited by Suicidal Guy: Mar 17 2021, 03:48 PM Attached thumbnail(s) 
|
|
|
Mar 18 2021, 10:35 AM
Show posts by this member only | IPv6 | Post
#4273
|
|
All Stars
12,267 posts Joined: Oct 2010 |
boon3 koh....i traded Tenaga. Bought at 10.12 at 26 Feb since they announced a 58 cent dividend.
sold at 10.86 18 March. For a 7 % profit. Is this the way to trade? This post has been edited by prophetjul: Mar 18 2021, 10:35 AM |
|
|
|
|
|
Mar 18 2021, 11:15 AM
|
|
All Stars
15,942 posts Joined: Jun 2008 |
QUOTE(prophetjul @ Mar 18 2021, 10:35 AM) boon3 koh....i traded Tenaga. Bought at 10.12 at 26 Feb since they announced a 58 cent dividend. Good for you. sold at 10.86 18 March. For a 7 % profit. Is this the way to trade?  I cannot do trades with such low profits margins. Based on my paper trades, in the long run, such trading yielded a below par results for me. Perhaps it's me. I am not good enough making such trades. Hence, I avoid such trades. But hey, if you can achieve such results consistently in the long run, well...... This post has been edited by Boon3: Mar 18 2021, 11:15 AM |
|
|
Mar 18 2021, 11:26 AM
Show posts by this member only | IPv6 | Post
#4275
|
|
All Stars
12,267 posts Joined: Oct 2010 |
QUOTE(Boon3 @ Mar 18 2021, 11:15 AM) Good for you. Actually, majority of my portfolio is in my yield bearing stocks. I cannot do trades with such low profits margins. Based on my paper trades, in the long run, such trading yielded a below par results for me. Perhaps it's me. I am not good enough making such trades. Hence, I avoid such trades. But hey, if you can achieve such results consistently in the long run, well...... My trading amount is ver tiny. Only about 20% of the whole portfolio. And i only trade like 5 times a year. That is a s much risk as i like to take on. |
|
|
Mar 18 2021, 11:43 AM
|
|
All Stars
15,942 posts Joined: Jun 2008 |
QUOTE(Boon3 @ Mar 18 2021, 11:15 AM) Good for you. prophetjul I cannot do trades with such low profits margins. Based on my paper trades, in the long run, such trading yielded a below par results for me. Perhaps it's me. I am not good enough making such trades. Hence, I avoid such trades. But hey, if you can achieve such results consistently in the long run, well...... the math behind it also explains why I avoid such trading in the long run.... Each trade valued at 10k. Each win equals 700. Out of 100 trades, if I win half of them, ie 50 win trades. All at 7%. 50 trades each win 7%. Total wins = 35k. Out of 50 losses. If manage to cap 25 losses capped at 5%. ie 500 loss per trade. Total losses = 12.5k. Cap 15 losses at 10%. ie 1k loss per trade. Total losses = 15k And unfortunately 10 losses at 15%. ie 1.5k per trade Total losses = 15k .... so out of 100 ... i will end up losing money. cos total losses = 42.5k vs total profit of 35k. Capping the losses.... ok, if can better it, eliminate those 15% losses.... Out of 50 losses, 25 losses capped at 5%. Total losses = 12.5k. 25 losses capped at 10%. Total losses = 25k. total losses = 37.5k.... ** Getting a win rate of more than 50% is not easy.... ** Capping losses. Not easy. We can say up front, we want 5% cut loss or 6% cut loss but it's not easy to execute... there will always exist slippage (ie that 5% easily becomes 10%), it happens. but that's me... I tried.... based on my paper trade records, I can NOT survive on such trading. |
|
|
Mar 18 2021, 02:12 PM
Show posts by this member only | IPv6 | Post
#4277
|
|
All Stars
12,267 posts Joined: Oct 2010 |
QUOTE(Boon3 @ Mar 18 2021, 11:43 AM) prophetjul Thanks for the explanation, Bro.the math behind it also explains why I avoid such trading in the long run.... Each trade valued at 10k. Each win equals 700. Out of 100 trades, if I win half of them, ie 50 win trades. All at 7%. 50 trades each win 7%. Total wins = 35k. Out of 50 losses. If manage to cap 25 losses capped at 5%. ie 500 loss per trade. Total losses = 12.5k. Cap 15 losses at 10%. ie 1k loss per trade. Total losses = 15k And unfortunately 10 losses at 15%. ie 1.5k per trade Total losses = 15k .... so out of 100 ... i will end up losing money. cos total losses = 42.5k vs total profit of 35k. Capping the losses.... ok, if can better it, eliminate those 15% losses.... Out of 50 losses, 25 losses capped at 5%. Total losses = 12.5k. 25 losses capped at 10%. Total losses = 25k. total losses = 37.5k.... ** Getting a win rate of more than 50% is not easy.... ** Capping losses. Not easy. We can say up front, we want 5% cut loss or 6% cut loss but it's not easy to execute... there will always exist slippage (ie that 5% easily becomes 10%), it happens. but that's me... I tried.... based on my paper trade records, I can NOT survive on such trading. I am learning a lot about trading from you. |
|
|
Mar 18 2021, 02:42 PM
Show posts by this member only | IPv6 | Post
#4278
|
|
All Stars
15,942 posts Joined: Jun 2008 |
QUOTE(prophetjul @ Mar 18 2021, 02:12 PM) Thanks for the explanation, Bro. I believe trading doesn't need to be wild punting.I am learning a lot about trading from you. |
|
|
Mar 18 2021, 02:44 PM
Show posts by this member only | IPv6 | Post
#4279
|
|
All Stars
12,267 posts Joined: Oct 2010 |
QUOTE(Boon3 @ Mar 18 2021, 02:42 PM) I believe trading doesn't need to be wild punting. i am just playing the safe ones.  Quite predictable. Come dividends, it rises. Therafter, it will drop. |
|
|
Mar 18 2021, 03:17 PM
Show posts by this member only | IPv6 | Post
#4280
|
|
All Stars
15,942 posts Joined: Jun 2008 |
QUOTE(prophetjul @ Mar 18 2021, 02:44 PM) i am just playing the safe ones. If that's your sweet spot, why not? Quite predictable. Come dividends, it rises. Therafter, it will drop. |
| Change to: |  0.0205sec 0.0205sec
 0.30 0.30
 6 queries 6 queries
 GZIP Disabled GZIP Disabled
Time is now: 28th November 2025 - 08:36 AM |
 Quote
Quote