

QUOTE(Smurfs @ Dec 14 2020, 03:01 PM)
Here is another descending triangle :


This stock under my blacklist.. 
It's trading in derivatives is huge......
Me no like.
PS: also it is not a descending triangle....
BWC
|
|
 Dec 14 2020, 03:08 PM Dec 14 2020, 03:08 PM
|

All Stars
15,942 posts Joined: Jun 2008 |
QUOTE(Smurfs @ Dec 14 2020, 03:01 PM) Here is another descending triangle : This stock under my blacklist.. It's trading in derivatives is huge...... Me no like. PS: also it is not a descending triangle.... |
|
|
|
|
|
Dec 14 2020, 03:13 PM
|

Senior Member
3,496 posts Joined: Dec 2007 |
QUOTE(Boon3 @ Dec 14 2020, 11:56 AM) Your trading lingo ... wow!Well.. once the MI earnings back to normal (last month was a surprise cos the earnings decline) ... it could be a sexy idea...  See .. this is why trading is always exciting .... If you are interested ... watch the candles... if the reversal candle is sighted tomorrow ... it should attract some ......  how bad can it go btw if no reversal candle for this ? |
|
|
Dec 14 2020, 03:26 PM
|
|
All Stars
15,942 posts Joined: Jun 2008 |
QUOTE(ChAOoz @ Dec 14 2020, 03:13 PM) Itching to enter MI. how bad can it go btw if no reversal candle for this ? That's a tricky question for couple reason(s) Most of all... I never could trade like that. I trade base on setups. If it falls or the reversal dont come... and if I am interested in the stock, my preference is to just let the stock fall and then, observe where and how it consolidates... And if I give out a point... its touchy... delicate.. it's almost a live trading guide... where some can easily mistake what I write... Yup.. I don't want that... and more so since what I wrote about Top Glove, lol, I better watch what I write. This post has been edited by Boon3: Dec 14 2020, 03:26 PM |
|
|
Dec 14 2020, 09:00 PM
|
|
Senior Member
3,373 posts Joined: Nov 2008 |
So the rather interesting question would be, when to anticipate and when to react and this is to each his own.
 lol lol mi is extremely bearish today in which perhaps the big funds are throwing off everything? I would monitor a few more day before doing anything though. Paper has been shaved by a huge chunk today. Haha. And ah boon big boss, many would have taken your sharing and suit themselves in eh? Anyway, money has been flowing from board to board, other than looking at charts, is chasing the breakout stocks a much better idea by switching the funds?  It sounded so wrong because it's basically trying to see which board is gonna move in the future regardless of future prospect of companies and charting alone. |
|
|
Dec 14 2020, 09:24 PM
|
|
All Stars
15,942 posts Joined: Jun 2008 |
QUOTE(billy_overheat @ Dec 14 2020, 09:00 PM) So the rather interesting question would be, when to anticipate and when to react and this is to each his own. It all depends on the stock. lol mi is extremely bearish today in which perhaps the big funds are throwing off everything? I would monitor a few more day before doing anything though. Paper has been shaved by a huge chunk today. Haha. And ah boon big boss, many would have taken your sharing and suit themselves in eh? Anyway, money has been flowing from board to board, other than looking at charts, is chasing the breakout stocks a much better idea by switching the funds? It sounded so wrong because it's basically trying to see which board is gonna move in the future regardless of future prospect of companies and charting alone. If you are sure that the upside potential is meaty... why not? Having said that, just chasing breakouts is suicidal. And even if you arm yourself with a huge warchest...and do all the stop loss, there won't be enough for you to lose in the long run. I am sure Aunty got teach you that all gals with mini skirts can be chased. This post has been edited by Boon3: Dec 14 2020, 09:30 PM |
|
|
Dec 14 2020, 09:58 PM
Show posts by this member only | IPv6 | Post
#3406
|

Junior Member
513 posts Joined: Dec 2006 |
Hi, i would like to practice day trading on a paper trading account like ThinkorSwim.
Is there anywhere I can refer to get live market data for free? |
|
|
|
|
|
Dec 14 2020, 10:33 PM
|

Senior Member
1,497 posts Joined: Dec 2005 |
QUOTE(bmwcaddy @ Dec 14 2020, 09:58 PM) Hi, i would like to practice day trading on a paper trading account like ThinkorSwim. https://www.tradingview.com/ has the datas but for live, they're delayed 15 minsIs there anywhere I can refer to get live market data for free? |
|
|
Dec 14 2020, 11:10 PM
|

Senior Member
1,033 posts Joined: Dec 2009 |
QUOTE(bmwcaddy @ Dec 14 2020, 09:58 PM) Hi, i would like to practice day trading on a paper trading account like ThinkorSwim. https://www.level2stockquotes.com/Is there anywhere I can refer to get live market data for free? Should be able to get what you need from the above website. Not the best solution but one of the best free option. |
|
|
Dec 15 2020, 08:30 AM
|
|
All Stars
15,942 posts Joined: Jun 2008 |
Glove sector
Comparison charts based on most recent 50 trading days... 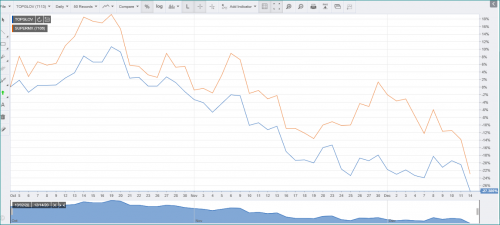 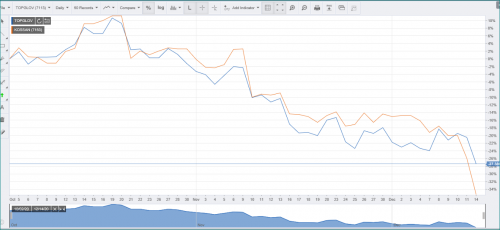 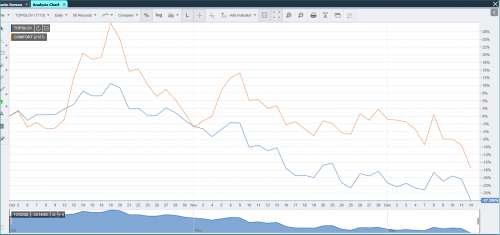  the group photo ..... 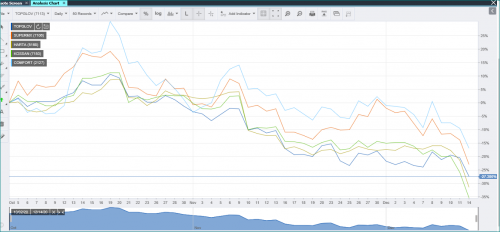 There are some interesting stuff one can gather from the individual comparison charts... . Market leaders lead.... This has always been the case .... Even in when market is declining note the case of Top Glove vs Kossan .... Kossan declined more In the case of Top Glove vs Harta ... Harta declined more That's why ... all issues aside ( ) ... if I had to .. it was always either Supermax or TopGlove... and Kossan? It was never ever considered. If Top Glove really breaks lower ... yes, there will always be pockets of rebound... nothing falls straight down.... but do watch out for the stale bull... this will be a massive issue in the future. |
|
|
Dec 15 2020, 08:46 AM
|
|
All Stars
15,942 posts Joined: Jun 2008 |
Chart of the day... 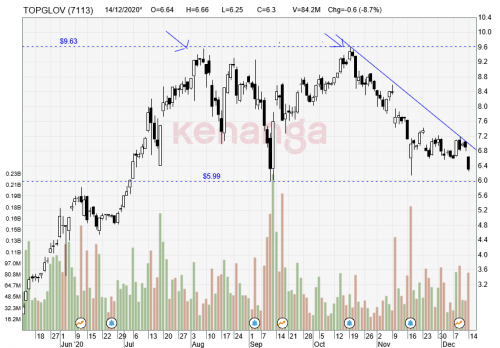 mitodna liked this post
|
|
|
Dec 15 2020, 08:50 AM
|

Senior Member
1,075 posts Joined: Apr 2010 |
QUOTE(Boon3 @ Dec 15 2020, 08:46 AM) Chart of the day... why the support is drawn at 5.99?? |
|
|
Dec 15 2020, 08:55 AM
|
|
All Stars
15,942 posts Joined: Jun 2008 |
QUOTE(squarepilot @ Dec 15 2020, 08:50 AM) why the support is drawn at 5.99?? That wasn't the support line. I don't draw support lines.  |
|
|
Dec 15 2020, 08:56 AM
|
|
Senior Member
1,075 posts Joined: Apr 2010 |
QUOTE(Boon3 @ Dec 15 2020, 08:55 AM) That wasn't the support line. I don't draw support lines. owh.. okay. i got you  |
|
|
|
|
|
Dec 15 2020, 04:54 PM
|
|
All Stars
15,942 posts Joined: Jun 2008 |
QUOTE(ChAOoz @ Dec 14 2020, 03:13 PM) Itching to enter MI. that should be a dragonfly doji .....how bad can it go btw if no reversal candle for this ? 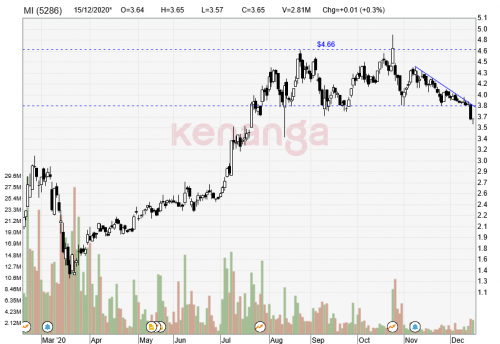 |
|
|
Dec 15 2020, 10:34 PM
Show posts by this member only | IPv6 | Post
#3415
|
|
Senior Member
1,075 posts Joined: Apr 2010 |
QUOTE(Boon3 @ Dec 15 2020, 04:54 PM) that should be a dragonfly doji ..... Confirmation needed. Need a long green candlestick to verify this |
|
|
Dec 16 2020, 08:50 AM
|
|
Senior Member
3,496 posts Joined: Dec 2007 |
QUOTE(Boon3 @ Dec 15 2020, 04:54 PM) that should be a dragonfly doji ..... Collected past 2 days. Hopefully got reversal of trend today  But fundamentally their customer is doing really well. Namely ASE/INARI, both having ramp up and opening up new production line. Once this rebound technically it might be a nice looking chart. |
|
|
Dec 16 2020, 08:55 AM
|
|
All Stars
15,942 posts Joined: Jun 2008 |
QUOTE(ChAOoz @ Dec 16 2020, 08:50 AM) Collected past 2 days. Hopefully got reversal of trend today LOL. See this thing with MI is not buying on timing. It's waiting for the right setup. As it is, we saw the dragonfly doji. Which just signals a trend reversal likey. It's considered a bullish candle. Some would react on that candle. But because it just broke down a descending triangle, the preference would be for another confirming candle today. But fundamentally their customer is doing really well. Namely ASE/INARI, both having ramp up and opening up new production line. Once this rebound technically it might be a nice looking chart. If you look at it... it's still a cliff hanger. It could go big either ways... This post has been edited by Boon3: Dec 16 2020, 10:39 AM |
|
|
Dec 16 2020, 01:29 PM
|
|
Senior Member
3,373 posts Joined: Nov 2008 |
Although the market hasn't closed today, the hammer which gapped up due to NASDAQ's performance yesterday might signify uncertainty?
However, if Darvas Box is drawn for the stage of such consolidation for around 140 days, can it mean that it's on 'support', although like what you said, support and resistance seldom make sense because they can be easily broken with no meaningful rationales? |
|
|
Dec 16 2020, 01:55 PM
|
|
All Stars
15,942 posts Joined: Jun 2008 |
QUOTE(billy_overheat @ Dec 16 2020, 01:29 PM) Although the market hasn't closed today, the hammer which gapped up due to NASDAQ's performance yesterday might signify uncertainty? I could never get a grip of the boxes. Some of its stuff do make sense but thru the few tests I did on it b4 couple of years ago, I could never feel comfy getting. Results were all over the place. It relies on time and then the screening process relies on the 52 week highs... which as you know is a no no for me...However, if Darvas Box is drawn for the stage of such consolidation for around 140 days, can it mean that it's on 'support', although like what you said, support and resistance seldom make sense because they can be easily broken with no meaningful rationales? Perhaps someone else can help you. |
|
|
Dec 16 2020, 02:04 PM
|
|
All Stars
15,942 posts Joined: Jun 2008 |
QUOTE(billy_overheat @ Dec 16 2020, 01:29 PM) Although the market hasn't closed today, the hammer which gapped up due to NASDAQ's performance yesterday might signify uncertainty? And I did not answer your hammer question. However, if Darvas Box is drawn for the stage of such consolidation for around 140 days, can it mean that it's on 'support', although like what you said, support and resistance seldom make sense because they can be easily broken with no meaningful rationales? Lol I just open the chart.. it's an inverted hammer la It depends on what type of trader you are. Sometimes looking at the live charts, you could anticipate easily (esp candles) what might happen if the stock closed at what prices. For example.. late on yesterday, it was rather likely that we could see the dragonfly doji.. and some traders would just dive into the stock in anticipation.... Get what I am saying? So it depends..... This post has been edited by Boon3: Dec 16 2020, 02:04 PM |
| Change to: |  0.0352sec 0.0352sec
 0.67 0.67
 6 queries 6 queries
 GZIP Disabled GZIP Disabled
Time is now: 26th November 2025 - 08:45 PM |
 Quote
Quote