QUOTE(AVFAN @ Jul 15 2020, 07:15 PM)

thanks for the comments.
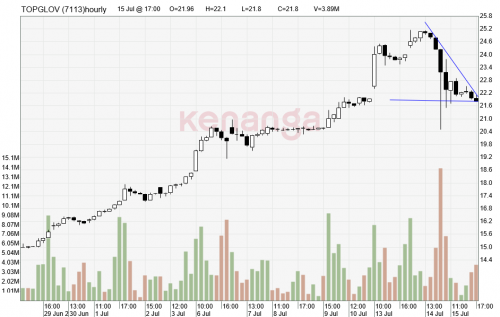
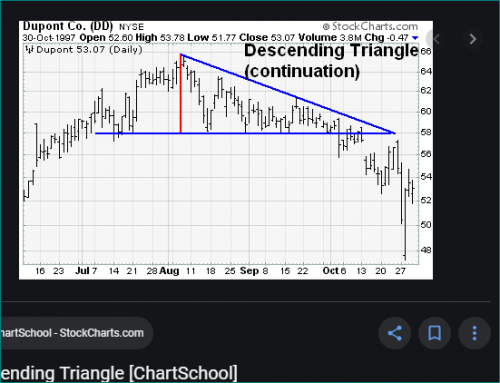
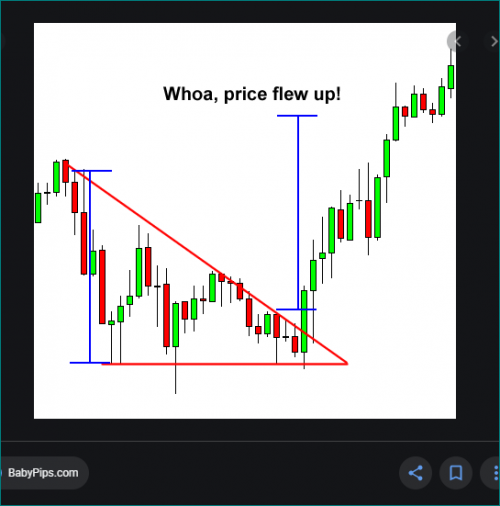
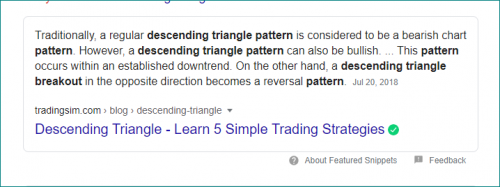
we shall see then if the descending triangle becomes bearish or breakout to bull.
i think it will be bear... becos i sold off everything this morning!

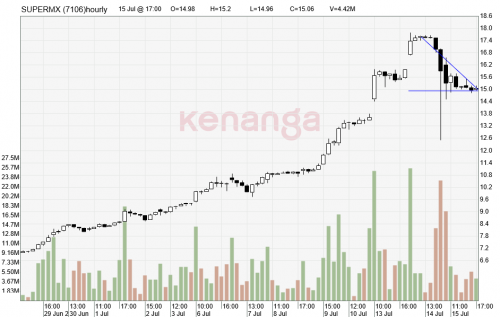
another thing i think i saw is harta price has crossed below the 5 and 10 day MA; TG the 5 day but supermax not yet.
harta looks to get more losses if i see it right.
ok, we will go thru this again by end of day tmr.
TQ once again.

Generally... it should be bearish.
If you look at that formed triangle... the highs are getting lower.... this is something most traders get worried about.... and given where and how high these stocks had shot up... the horizontal line forming the descending triangle doesn't look much of a support, does it? So for example if Superman goes below 15 again a lot of ppl would probably get very nervy and panicky.... and as they say, one thing leads to another... and viola ... you have a breakdown....
and yes, it's much better that one let the stock lead the way. Let it show if it wants to breakdown or breakout....
and then yes, I have seen many that tend to jump the gun...
they see the descending triangle forming...
and they quickly jump the gun... kiasu ma... early birdie get the worm... so they fast fast short the stock...
but alas...
the stock breakout instead of breaking down...
they lose and then they blame...
cilaka chart pattern...
sibeh cannot use one....

LOL!
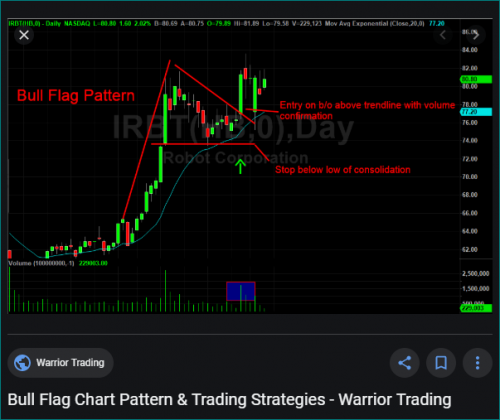
Cup and Handle is one pattern where one tends to jump the gun...
and yeah... I would agree with you that Harta looks very weak...
This post has been edited by Boon3: Jul 15 2020, 08:05 PM 

 Jul 15 2020, 05:23 PM


 Quote
Quote


 0.0196sec
 0.97
0.97
 6 queries
 GZIP Disabled