Welcome Guest ( Log In | Register )

233 Pages « < 47 48 49 50 51 > » Bottom

Outline · [ Standard ] · Linear+

 BWC

views
     
TSBoon3
post Jul 20 2017, 04:35 PM

10k Club
********
All Stars
15,942 posts

Joined: Jun 2008
QUOTE(Boon3 @ Jun 10 2017, 06:49 PM)
Ah.... 'listening to a blogger'.... tongue.gif

You should develop your own strength. Listening to others could mess you up (me included  cool2.gif  tongue.gif )

Anyway... it's past already. You took half profit already. What I would suggest is mark this one trade down into your 555 book for future reference. Keep track of your success and those not so successful. See where you can improve yourself.  icon_rolleyes.gif
hehe.... for stock whose earnings are growing (or turning around) , it's better to know what stage of the growth you are in. Growth do not last forever and usually after a robust growth period, growth tends to slows...... this is my general believe.
ps: anyway, your reasoning process is well thought out. well done and good luck to your new trade.  icon_rolleyes.gif
*
twhong_91

See? 395 also got.

twhong_91
post Jul 21 2017, 12:10 AM

01.01.2012
******
Senior Member
1,637 posts

Joined: Mar 2010
From: Bolehland


QUOTE(Boon3 @ Jul 20 2017, 04:35 PM)
twhong_91

See? 395 also got.
*
Haha... mistake learnt. Was anticipating a 40c breakout but at least it went as high as 395. Holding tight till the next qr to decide whether to hold or sell.

Already 50% gains but i believe ppl who enter lower would earn much higher.

On that of that many investment banks started to cover it, tp 0.43 and 0.45?


TSBoon3
post Jul 21 2017, 07:34 AM

10k Club
********
All Stars
15,942 posts

Joined: Jun 2008
QUOTE(twhong_91 @ Jul 21 2017, 12:10 AM)
Haha... mistake learnt. Was anticipating a 40c breakout but at least it went as high as 395. Holding tight till the next qr to decide whether to hold or sell.

Already 50% gains but i believe ppl who enter lower would earn much higher.

On that of that many investment banks started to cover it, tp 0.43 and 0.45?
*
The important thing is that 'taking half profit' isn't really a solid strategy.
IF the reason to enter the trade was SOLID enough, selling half is simply throwing away something good.
The better option is just to sit tight.

I know such strategy is rather difficult to implement cos of the many temptations to either...

1. switch to other stock
2, trying to catch every single up and downs of the stock. ie sell at a 'high' and trying to catch it back when it falls to a 'low'.... ie the IN and OUT trader.


lihongmint
post Jul 24 2017, 02:04 PM

Getting Started
**
Junior Member
164 posts

Joined: Jun 2017
QUOTE(djhenry91 @ Jun 30 2017, 03:44 PM)
PDT issit?
depend which broking firm offer better for PDT thn join
tax need declare transparent
depend what kind offer for equities and futures
*
Yeah, PDT

How much of profit sharing percentage in the industry?

Seems like you know a lot, you are one of the PDT?
djhenry91
post Jul 24 2017, 02:30 PM

Slow and Steady
*******
Senior Member
6,779 posts

Joined: Jan 2009
From: SEGI Heaven


QUOTE(lihongmint @ Jul 24 2017, 02:04 PM)
Yeah, PDT

How much of profit sharing percentage in the industry?

Seems like you know a lot, you are one of the PDT?
*
nope..there is one guy ask me want join or not.few years ago..
depend how good are u nego with company
twhong_91
post Jul 24 2017, 10:37 PM

01.01.2012
******
Senior Member
1,637 posts

Joined: Mar 2010
From: Bolehland


QUOTE(Boon3 @ Jul 21 2017, 07:34 AM)
The important thing is that 'taking half profit' isn't really a solid strategy.
IF the reason to enter the trade was SOLID enough, selling half is simply throwing away something good.
The better option is just to sit tight.

I know such strategy is rather difficult to implement cos of the many temptations to either...

1. switch to other stock
2, trying to catch every single up and downs of the stock. ie sell at a 'high' and trying to catch it back when it falls to a 'low'.... ie the IN and OUT trader.
*
So what do you do to not to be tempted by these temptations that you mentioned? Haha
TSBoon3
post Jul 25 2017, 07:35 AM

10k Club
********
All Stars
15,942 posts

Joined: Jun 2008
QUOTE(twhong_91 @ Jul 24 2017, 10:37 PM)
So what do you do to not to be tempted by these temptations that you mentioned? Haha
*
laugh.gif

How do you resist real life temptations?

tongue.gif
twhong_91
post Jul 25 2017, 01:49 PM

01.01.2012
******
Senior Member
1,637 posts

Joined: Mar 2010
From: Bolehland


QUOTE(Boon3 @ Jul 25 2017, 07:35 AM)
laugh.gif

How do you resist real life temptations?

tongue.gif
*
Lol... wise words. Understand understand.
Suicidal Guy
post Jul 27 2017, 01:56 AM

On my way
****
Senior Member
567 posts

Joined: Feb 2006
hai cikgu...

i have a question to ask..

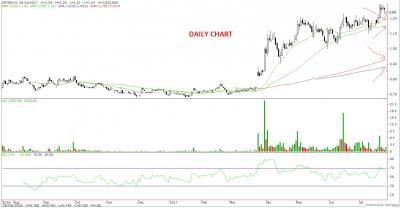
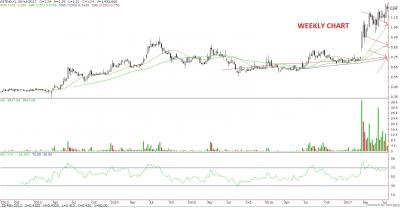
i notice this SMA line (20-day, 50-day, 150-day and 200-day) are at different price in a daily and weekly chart. Why is it different? My understanding is that it should be at the same price no matter what time frame chart you choose... confused.gif

Example below...

Daily Chart
Attached Image

Weekly Chart
Attached Image


BTW this stock can buy or not? Tipsy pleaseeeee.... tongue.gif
hehe86
post Jul 27 2017, 02:32 AM

Gratitude
******
Senior Member
1,497 posts

Joined: Dec 2005
The EMA/MA indicator uses the candlestick to calculate. So for each timeframe, those candlesticks have different closing price, hence the difference of MA/EMA
Suicidal Guy
post Jul 27 2017, 09:19 AM

On my way
****
Senior Member
567 posts

Joined: Feb 2006
QUOTE(hehe86 @ Jul 27 2017, 02:32 AM)
The EMA/MA indicator uses the candlestick to calculate. So for each timeframe, those candlesticks have different closing price, hence the difference of MA/EMA
*
Supposed one is using moving averages as support line indicator, then there would be two support line if choose between daily and weekly chart.. which one to use ahh?

Terima kasih cikgu..


hehe86
post Jul 27 2017, 09:54 AM

Gratitude
******
Senior Member
1,497 posts

Joined: Dec 2005
Eh i'm nobody cikgu, i still have long ways to learn lol

To use what moving average as support line on which timeframe, guess u have to ask yourself you wanna trade short-term or long-term/swing trader. No best answer here, depending on your method

Some use MAs in weekly to just check the trend, follow trend/counter trend, then dive into daily to find entries. Then one may use a shorter MA/EMA like 10/20 as support line etc. Best is to backtest/paper trade to know which suits u best
TSBoon3
post Jul 27 2017, 10:05 AM

10k Club
********
All Stars
15,942 posts

Joined: Jun 2008
QUOTE(Suicidal Guy @ Jul 27 2017, 09:19 AM)
Supposed one is using moving averages as support line indicator, then there would be two support line if choose between daily and weekly chart.. which one to use ahh?

Terima kasih cikgu..
*
These EMA lines .... they are lousy indicators. laugh.gif tongue.gif

OK... dun take my word for granted ... which means .... the best way to test it out.

Know the time frame you are trading. *ahem*

If you are into daily trading, the EMA 20 is not gonna cut it. Some would suggest switching to shorter EMA 10.

In short the shorter the time frame your trading is based upon, the shorter EMA is recommended. Which one? Ah... the discovery period should help... a lot.
Mark down the EMA 10 and the EMA 15.
Run some fake trades on it.
See the end result.
Which suits you better?

Now if you are a longer period (6 months at least) , then the weekly chart are more important than the daily ones.

Mess around la...

See which one you die less.....

laugh.gif
johnnyzai89
post Jul 27 2017, 10:35 AM

Regular
******
Senior Member
1,444 posts

Joined: Aug 2014
Ah boon, for all time high flying stocks..
how do you determine the next resistance level ah?
using fibo ah? or there is no way of telling
TSBoon3
post Jul 27 2017, 11:11 AM

10k Club
********
All Stars
15,942 posts

Joined: Jun 2008
QUOTE(johnnyzai89 @ Jul 27 2017, 10:35 AM)
Ah boon, for all time high flying stocks..
how do you determine the next resistance level ah?
using fibo ah? or there is no way of telling
*
It depends and the strategy applied depends on individual user.

If you are more fundamental based player, your focus is probably on the valuation. Is the current price way ahead of its future prospects? If so, sell lo.

Sometimes the price is way ahead of its current valuation but then the future prospects is so enticing that perhaps it's better to sit tight.

Charts. If you are a long term player, ie you believe greatly on the company's future prospect, then you should avoid all those short term indicators and stuff like supports and resistance. Failure to do so will see one shooting themselves in the foot. Big gains come from the waiting game.

The major trend. Watch that.

The weekly charts.


lihongmint
post Jul 27 2017, 11:29 AM

Getting Started
**
Junior Member
164 posts

Joined: Jun 2017
day traders, what tools you guys use to scan which high flying stocks to trade on the day?
johnnyzai89
post Jul 27 2017, 11:52 AM

Regular
******
Senior Member
1,444 posts

Joined: Aug 2014
QUOTE(Boon3 @ Jul 27 2017, 12:11 PM)
It depends and the strategy applied depends on individual user.

If you are more fundamental based player, your focus is probably on the valuation. Is the current price way ahead of its future prospects? If so, sell lo.

Sometimes the price is way ahead of its current valuation  but then the future prospects is so enticing that perhaps it's better to sit tight.

Charts. If you are a long term player, ie you believe greatly on the company's future prospect, then you should avoid all those short term indicators and stuff like supports and resistance. Failure to do so will see one shooting themselves in the foot. Big gains come from the waiting game.

The major trend. Watch that.

The weekly charts.
*
hehehe thanks thanks!!
rclxms.gif rclxms.gif

this thread has been so quiet these days sad.gif
Suicidal Guy
post Jul 27 2017, 12:48 PM

On my way
****
Senior Member
567 posts

Joined: Feb 2006
QUOTE(hehe86 @ Jul 27 2017, 09:54 AM)
Eh i'm nobody cikgu, i still have long ways to learn lol

To use what moving average as support line on which timeframe, guess u have to ask yourself you wanna trade short-term or long-term/swing trader. No best answer here, depending on your method

Some use MAs in weekly to just check the trend, follow trend/counter trend, then dive into daily to find entries. Then one may use a shorter MA/EMA like 10/20 as support line etc. Best is to backtest/paper trade to know which suits u best
*
haha as long as you teach me something then you are my cikgu laa.. tongue.gif

what you said is similar to what i have read.. that is to have an aerial view of the longer term trend to be in your favour by looking at the long term chart and have the long term MA line upward.. then only look at proper base set up to enter.. and some other rules such as price is trading above MA, short term MA line above long term MA line.. etc..

QUOTE(Boon3 @ Jul 27 2017, 10:05 AM)
These EMA lines .... they are lousy indicators. laugh.gif tongue.gif

OK... dun take my word for granted ... which means .... the best way to test it out.

Know the time frame you are trading. *ahem*

If you are into daily trading, the EMA 20 is not gonna cut it. Some would suggest switching to shorter EMA 10.

In short the shorter the time frame your trading is based upon, the shorter EMA is recommended. Which one? Ah... the discovery period should help... a lot.
Mark down the EMA 10 and the EMA 15.
Run some fake trades on it.
See the end result.
Which suits you better?

Now if you are a longer period (6 months at least) , then the weekly chart are more important than the daily ones.

Mess around la...

See which one you die less.....

laugh.gif
*
Previously I buy only based on fundamentals.. my fundamental analysis also not so good la.. just enough to avoid lemons.. the returns are satisfactory but definitely could be better if incorporate some chart skills to know when to buy and sell.. my previous buys are usually too early and sell is too late.. that's what i hope to improve on..

Btw, I start to track my average gains and losses to know what is my expectancy...


TSBoon3
post Jul 27 2017, 02:00 PM

10k Club
********
All Stars
15,942 posts

Joined: Jun 2008
QUOTE(Suicidal Guy @ Jul 27 2017, 12:48 PM)
haha as long as you teach me something then you are my cikgu laa..  tongue.gif

what you said is similar to what i have read.. that is to have an aerial view of the longer term trend to be in your favour by looking at the long term chart and have the long term MA line upward.. then only look at proper base set up to enter.. and some other rules such as price is trading above MA, short term MA line above long term MA line.. etc..
Previously I buy only based on fundamentals.. my fundamental analysis also not so good la.. just enough to avoid lemons.. the returns are satisfactory but definitely could be better if incorporate some chart skills to know when to buy and sell.. my previous buys are usually too early and sell is too late.. that's what i hope to improve on..

Btw, I start to track my average gains and losses to know what is my expectancy...
*
Improving on late selling is not that difficult.

Selling too late usually does not happen in stocks with real solid future prospects.

Selling too late (which turns the trade into losses) usually happen in stocks with not so good fundamentals, ie goreng stocks. Most of the time, in such cases, the chef has left the building, leaving holders with losses. In such cases, learning when to sell (exit a trade) is important. Search via Google. Plenty there.

I always believe in buying right. Buying correctly makes the selling decisions much easier.

're expectancy. Tracking is important but it would be better if you could know your averages on different strategies.

TSBoon3
post Jul 28 2017, 08:18 PM

10k Club
********
All Stars
15,942 posts

Joined: Jun 2008
Update.... tongue.gif

user posted image

Oh that 49 sen? That was just a mark on when I posted last on it....


» Click to show Spoiler - click again to hide... «


233 Pages « < 47 48 49 50 51 > » Top
 

Change to:
| Lo-Fi Version
0.0157sec    0.35    6 queries    GZIP Disabled
Time is now: 25th November 2025 - 02:40 AM