Welcome Guest ( Log In | Register )

Bump Topic Topic Closed RSS Feed
13 Pages « < 4 5 6 7 8 > » Bottom

Outline · [ Standard ] · Linear+

 Fund Investment Corner v2, A to Z about Fund

views
     
wongmunkeong
post Jan 12 2012, 02:13 PM

Barista FIRE
Group Icon
Elite
5,608 posts

Joined: May 2011
From: Here, There, Everywhere


QUOTE(cherroy @ Jan 12 2012, 02:07 PM)
Yup.

DDI works better than lump sum if the fund performance like
Start
1.00
0.90
0.80
then 1.00
and finally 1.20.

That's why I said DDI only works well in certain circumstance. If only works well in circumstances which depended how situation unfold and not a foolproof to eliminate the risk. In real term, more risk being taken due to more money being committed into the same fund.

I know every agent will push hard on DDI, I won't discourage or encourage on this.
But investors deserved to know the flaw and potential risk of DDI that can make greater loss in the future.
The statement of DDI works well doesn't necessary true.
*
Yup Yup, and I have yet to actually see in practice, an agent doing VCA, a better methodology than DCA, for the above example of up/down real world scenario. Too much real work gua tongue.gif Pair VCA to an average equity fund, cukup - needn't be best of the best fund biggrin.gif
wongmunkeong
post Jan 12 2012, 04:52 PM

Barista FIRE
Group Icon
Elite
5,608 posts

Joined: May 2011
From: Here, There, Everywhere


QUOTE(JeffreyYap @ Jan 12 2012, 02:45 PM)
Ya this is what my friend told me too. Both have the same SC.
*
Different POV - time-value of $ is different.
eg. $10,000 SC gotten in 2011 Jan
VS $10,000 SC spread through 3 years DDI (ie. by end of 3rd year then only finish collecting the $10K)
tongue.gif

Not to mention "locking in" a customer's $ upfront if whack one lump sum. Then can laugh at other consultants trying to get a piece of the action from that customer. hmm.gif

This post has been edited by wongmunkeong: Jan 12 2012, 04:53 PM
wongmunkeong
post Jan 12 2012, 05:13 PM

Barista FIRE
Group Icon
Elite
5,608 posts

Joined: May 2011
From: Here, There, Everywhere


QUOTE(gark @ Jan 12 2012, 05:07 PM)
Yeah.. this DDI is a double edge sword.. what if the following scenario happen how?

Start
1.00
0.95
0.90
0.80
0.75
0.70

Then how? In stock terms we call this 'catching falling knife'  laugh.gif There is no guarantee DDI can help you make back your losses... depending on the performance of fund. It also could be like the above, one way ticket to disaster...
*
Enron, WorldCom, Bernard Maddoff's funds and Lehman brothers style laugh.gif
wongmunkeong
post Jan 13 2012, 10:42 PM

Barista FIRE
Group Icon
Elite
5,608 posts

Joined: May 2011
From: Here, There, Everywhere


QUOTE(Pink Spider @ Jan 13 2012, 08:47 PM)
guys,

just wanna hear some comments...

i started my UT portfolio during mid-2008, doing RSP (DDI for some of u) RM100 monthly til end of 2010, along the way also pumped in bits on and off, then stopped cos I felt that markets are peaking. My portfolio are largely conservative-balanced except for a global fund focused on banks/financials (this fund is the biggest drag on my portfolio doh.gif )

to-date my portfolio returned about 6%, annualised return=1.7%

is this considered "reasonable" for the past 4 years? unsure.gif

sifu sifu sekalian tolong komen notworthy.gif
No seafood here, just a lemming sharing tongue.gif.

Just purely for tracking & reference purposes, i've been tracking and re-distributing dividends by PER TRANSACTION (date in, cost, units received + dividend units, current value) and below is using Excel's XIRR function on the dates, cash out and total value now, to get time-cost returns/losses of $.

Side note - the below aint all mine yar, just my tracking for myself, family and friends (else severe overlaps).

Buy & hold since May 2005
Prudential SmallCap,
lump sum in 18/05/2005, 26/08/2005, 15/01/2007
with dividends re-invested & no profit taking/switching rules
is netting as of 12/1/2012, approximately 9.54%pa

-----
DCA+VCA +switched in profits lock-in since Apr 2008
Public Bond Fund
with dividends re-invested
is netting as of 12/1/2012, approximately 7.81%pa

DCA+VCA since Apr 2008
Public Aggressive Growth Fund
with dividends re-invested & with profit taking/switching rules
is netting as of 12/1/2012, approximately 4.48%pa EXCLUDING profits switched out to bond fund

Public Industry Fund
with dividends re-invested & with profit taking/switching rules
is netting as of 12/1/2012, approximately 6.38%pa EXCLUDING profits switched out to bond fund

Public SmallCap Fund
with dividends re-invested & with profit taking/switching rules
is netting as of 12/1/2012, approximately 7.59%pa EXCLUDING profits switched out to bond fund

-----
DCA+VCA since May 2009
Public Index Fund
with dividends re-invested & with profit taking/switching rules
is netting as of 12/1/2012, approximately 9.23%pa EXCLUDING profits switched out to bond fund

Public Sector Select Fund
with dividends re-invested & with profit taking/switching rules
is netting as of 12/1/2012, approximately 9.18%pa EXCLUDING profits switched out to bond fund

Public Regional Sector Fund
with dividends re-invested & with profit taking/switching rules
is netting as of 12/1/2012, approximately -18.23%pa EXCLUDING profits switched out to bond fund

Public Public Far-East Property & Resorts Fund
with dividends re-invested & with profit taking/switching rules
is netting as of 12/1/2012, approximately 8.96%pa EXCLUDING profits switched out to bond fund

Public Public Far-East Select Fund
with dividends re-invested & with profit taking/switching rules
is netting as of 12/1/2012, approximately -13.21%pa EXCLUDING profits switched out to bond fund

----
DCA+VCA +switched in profits lock-in since Feb 2011
Public Strategic Bond Fund
with dividends re-invested
is netting as of 12/1/2012, approximately 5.83%pa

This post has been edited by wongmunkeong: Jan 13 2012, 10:44 PM
wongmunkeong
post Jan 13 2012, 10:59 PM

Barista FIRE
Group Icon
Elite
5,608 posts

Joined: May 2011
From: Here, There, Everywhere


QUOTE(transit @ Jan 13 2012, 10:50 PM)
Wong: I really like your tracking ~_~ Keep it up ~_~
*
Transit, I'm a typical nerd mar - no tracking = no stats = cant make proper decisions to get out of that stupid fund OR continue OR pour more $ in tongue.gif

Side notes / thoughts:
a. The buy & hold Prudential SmallCap is performing as expected long term 8%pa to 10%pa
b. PRSEC & PFES - looks familiar red color like end 2008 / early 2009 but in late 2009 & 2010.. nice leh the %pa. Thus, i think one needs to see ending periods that are "normal-ler" than now as well.
c. Who says bond funds are useless? Checkout PBOND's results. Dont lar PSTBF - forced into that coz PBOND full already and it just started.
wongmunkeong
post Jan 13 2012, 11:01 PM

Barista FIRE
Group Icon
Elite
5,608 posts

Joined: May 2011
From: Here, There, Everywhere


QUOTE(JeffreyYap @ Jan 13 2012, 10:55 PM)
Oh, i can buy more than one fund with one public mutual account?
JeffreyYap, pls read previous threads & versions of this topic + the public mutual topic/thread (current and past).
U'll find out that one can EVEN have more than 1 account of PIX or PAGF or any funds (due to different servicing agents tongue.gif). eg. U can have 2 PIX accounts, 3 PAGF accounts, etc.

Of course other than that, you'll find even more nuggets of knowledge from fellow forumers by DIGGING for them and reading yar brows.gif

This post has been edited by wongmunkeong: Jan 13 2012, 11:03 PM
wongmunkeong
post Jan 16 2012, 12:15 PM

Barista FIRE
Group Icon
Elite
5,608 posts

Joined: May 2011
From: Here, There, Everywhere


QUOTE(Pink Spider @ Jan 16 2012, 11:38 AM)
I know, but what's 1% exit fee compared to consistent 9-10% p.a. returns over past 5 years?
*
Dang.. U sure it's CAGR 9%pa to 10%pa consistently for the past 5 and more years (after minusing the 1% mgt fee + 0.05% trustee fee)?
Can advise where can i get the stats? notworthy.gif danke danke
Nice for my "severe emergency funds" - ie. not for holding ammunition while waiting for value or trend buying of Equities.
wongmunkeong
post Jan 18 2012, 06:51 PM

Barista FIRE
Group Icon
Elite
5,608 posts

Joined: May 2011
From: Here, There, Everywhere


QUOTE(bursalchemy @ Jan 18 2012, 04:31 PM)
Is there any fund can beat ASB return consistently since 2000?
*
Would these do?
Only have PM's data - from PBond upwards, CAGR is about 8%pa+
My personal holding in Prudential SmallCap averages 8%pa+ to 9%pa+ now. Was 25%pa+ CAGR in 2006-2007

Please note that ASB Vs others arent really apple vs apple comparison yar. Fixed price mutual funds are magical creatures, thus, reality doesn't apply to them.
I'm just sharing the long term average CAGR as per your Q, since year 2000.

Additional note: IMHO, viewing the results for just 1 ending period (ie. 2012) may not show a proper view. Should see also ending period Dec 2008 (bad ending?) and ending period Dec 2010 (good ending?) tongue.gif.

Attached Image

Attached Image

This post has been edited by wongmunkeong: Jan 18 2012, 07:13 PM
wongmunkeong
post Jan 18 2012, 08:35 PM

Barista FIRE
Group Icon
Elite
5,608 posts

Joined: May 2011
From: Here, There, Everywhere


QUOTE(Pink Spider @ Jan 18 2012, 07:22 PM)
seems that malaysian equity funds beat global equity funds or even asia ex-japan equity funds hands down...is this just an abnormal deviation (cos malaysian market = defensive, recent years global equities are quite bearish), or our local fund managers really dunno invest overseas? hmm.gif

cos everyone wrote that diversification is healthy, but overseas exposure are dragging down our portfolio performance... sweat.gif
*
Diversification is one thing. OVER die-worse-ify is bad hehe - average of average.
And as U mentioned, certain countries or continents need insider / local knowledge to invest better.

Just a thought
wongmunkeong
post Jan 19 2012, 12:42 PM

Barista FIRE
Group Icon
Elite
5,608 posts

Joined: May 2011
From: Here, There, Everywhere


QUOTE(MGM @ Jan 19 2012, 12:09 PM)
Read this article and its comments:
http://www.themalaysianinsider.com/busines...olls-says-bofa/

What is the best course of action to take if there is a change of govt.?
Sell all KLSE stocks and local funds and keep cash before GE13?
After GE observe and slowly accumulate non-BN bluechip stocks?
*
Heheh - analyst predictions.. right...

BTW, last election fiasco - index dropped 10% and KLSE circuit breaker kicked-in.
For the "rest of the fall" in 2008, not due to election IMHO but due to the credit crisis thanks to US (BofA analyst from yr link, hm...).
Thus, 10% drop no biggie if only 30%+ of my assets in KLSE equities, assuming my counters held actually fell 10%. In fact, it's a nice to to buy good businesses at discounted prices if one has ammunition held for such opportunity targets.

Anyways, until crystal balls are invented & analysts' predictions are on the money AND on time, i'll continue on with Asset Allocation executed via 50% Value Averaging+DCA & 50% Opportunity/Lelong purchases tongue.gif

Just a thought notworthy.gif
wongmunkeong
post Jan 19 2012, 01:21 PM

Barista FIRE
Group Icon
Elite
5,608 posts

Joined: May 2011
From: Here, There, Everywhere


QUOTE(MGM @ Jan 19 2012, 01:06 PM)
Wongmunkeong, always like to read your views.

But in GE12 BN won but with reduced majority, scenario could be diff if Pakatan wins. This round I think whoever wins ( it will be very close)  the market will still lose, at least initially.
My strategy is:
Before GE, keep all my fixed-price ASNB funds, sell off all my KLSE stocks and keep cash.
After GE, buy non-BN bluechips with the cash-in-hand and slowly switch from ASNB funds to non-BN bluechips.
*
domo domo for your kind thoughts.

I agree with U if U are making / profiting like 10%pa+ already, good idea to take some risks off the table.
I think the question then would be:
a. How much to take off the table?
b. If kaka doesnt hit the fan (ie. no severe or long drops), then your cash holding how?
Should have re-entry plans if it happens (U have already) and if it doesnt happen methinks. Just in case lar

Just thinking in terms of exit/entry cycle yar, no right or wrong.

Just to toss some really obvious things into the fray:
2012 - ppl claiming end of the world around Nov / Dec
These people, will they do whatever they want, sell everything off & enjoy?
If they do, what are their "re-entry" plans IF end of the world doesn't happen?
No plans - ie. if world doesnt end, they end themselves? tongue.gif

Yar yar i know the 2012 end of world thing above is really "kua cheong" (ridiculous example), just that sometimes, examples of ridiculousness helps put things in perspective.

Just a thought notworthy.gif

This post has been edited by wongmunkeong: Jan 19 2012, 01:23 PM
wongmunkeong
post Jan 19 2012, 01:48 PM

Barista FIRE
Group Icon
Elite
5,608 posts

Joined: May 2011
From: Here, There, Everywhere


QUOTE(Pink Spider @ Jan 19 2012, 01:24 PM)
e.g. ur strategy is value increase Fund ABC by RM100 every month

Jan-12 ABC dropped -RM100, so u will buy in RM200
Feb-12 ABC increased RM50, so u will buy in RM50

ini maksud "Value Averaging"? unsure.gif
*
Too simplistic Pink Spider.

Please refer to these books & PDF + google "TwinVest" as well to get "ini maksud".
Way too involved for me to explain the 2 to 3 methodologies here to U, although i can do a simple snapshot of execution calculation and results - though that may cause even more rclxub.gif

Value Averaging: The Safe and Easy Strategy for Higher Investment Returns
http://www.amazon.com/Value-Averaging-Stra...26951581&sr=8-1

How to Make $1,000,000 in the Stock Market Automatically
http://www.amazon.com/How-Make-Stock-Marke...26951600&sr=1-1

A STATISTICAL COMPARISON OF VALUE AVERAGING VS. DOLLAR COST AVERAGING AND RANDOM INVESTMENT TECHNIQUE
http://www.studyfinance.com/jfsd/pdffiles/v13n1/marshall.pdf

Again, please note that i couple these with Asset Allocation, allocated resources % & filtered stocks / equity funds / REITs based on my own requirements yar (eg. consistent several years' ROE > or = xx%, D/E < or = x.x, +ve cashflow, DPS growth > or = x.x%, etc.).
Your mileage may vary - just like same martial arts, different practitioner notworthy.gif

This post has been edited by wongmunkeong: Jan 19 2012, 01:50 PM
wongmunkeong
post Jan 19 2012, 03:26 PM

Barista FIRE
Group Icon
Elite
5,608 posts

Joined: May 2011
From: Here, There, Everywhere


QUOTE(MGM @ Jan 19 2012, 02:17 PM)
Bro Wong, when did u start investing methodically, and what is your CAGR since then? I am sure you are one of the few who keep track of your investment at all time.

Bought one of the book highly recommended by u, "Secrets of the millionaire ..." but have not read yet. Could not find the book on Twinvest.
*
Hey ya MGM. Me - methodologically?

Since.. hm.. 2004/2005, decided to put real $ to test & track a few methodologies (entries & exits) coupled with filteration & AA (asset allocation). I'm an idiot - no real $ on the line, i get lazy tracking tongue.gif Of course i did some back testing with historical prices / NAV too for 10 years and 5 years stretch but nothing beats real $ on the line to see if i will follow-through/how easy to execute.

Tried out TwinVest, AIM-HI, Trend as per the book "The TRENDadvisor Guide to Breakthrough Profits" and a few not too smart totally TA-based entries & exits (hey, i'm as dumb/smart as the next fellow laugh.gif).
All in all, found that value opportunities + TwinVest + Trend works well in combination with my personal filtering methods.

Once done, in 2009 - i "rebooted" nearly all my investments and started "clean" with 50% of ammunition in Programmatic (no fear/greed) via TwinVest + 50% in Opportunistic (Value opportunities + Trend) executions to hit my AA.

Note - before 2004/2005 - was only using value opportunity entries for stocks (no REITs then) & DCA / lump sum for mutual funds.
----

Hm.. my CAGR in totality? Unsure wor.
er.. i dont count total other than Net Worth which thus far, ranges from 18.91%pa to 43.83%pa (woohoo end 2008 / early 2009 to mid 2010 tongue.gif) based on a moving 12mths average differences.

Detailed CAGR got lar based on per transaction in stocks & REITs OR group of mutual funds via a methodology biggrin.gif
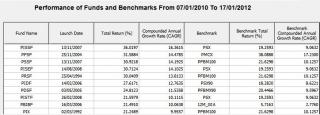
Please note that the data below are based on 18/01/2012 NAV and limited to mutual funds only (since mutual funds' thread mar):
Prudential SmallCaps via buy lump sum (3 times) and hold stupidly since 2005: 9.56%pa
PFEPRF via Trend opportunity since 2009: 20.84%pa

PFEPRF via TwinVest since 2009: 3.80%pa
PIX via TwinVest since 2009: 9.06%pa
PSSF via TwinVest since 2009: 8.56%pa

PFES via DCA since Jan 2008: -7.91%

PBOND as just a storage for unused $ until deployed since rebooting 2009: 8.19%pa
PSBF as a storage for unused $ via EPF until deployed since rebooting 2009: 6.10%pa

Things i think of interest:
a. Wah! Bond funds' consistent returns are nothing to sneeze at. Dang the sales agents that keep pushing just Equity Funds
b. PFEPRF bought via Trend Entry - i made >66% net profit in less than 1 year. Took my cost +10%pa expected profits off the table, left the abnormal profits to run till now.
c. Prudential SmallCaps - buy & hold still works (assuming semi-good to good fund/fund mgt lar). This thing climbed to 26%pa+ before 2008!
d. PFES - whoa.. this thing can really swing. Good times can be > or = 25%pa (i take profits when > or = 25%pa and had several transactions hitting that earlier tongue.gif), bad times.. tadaa

pheww.. my apologies for the long winded post. i hope the above helps gauge whether TwinVest, Trend + Buy & Hold is worthwhile or not notworthy.gif


Added on January 19, 2012, 3:50 pm
QUOTE(MGM @ Jan 19 2012, 02:17 PM)
Bro Wong, when did u start investing methodically, and what is your CAGR since then? I am sure you are one of the few who keep track of your investment at all time.

Bought one of the book highly recommended by u, "Secrets of the millionaire ..." but have not read yet. Could not find the book on Twinvest.


Added on January 19, 2012, 2:31 pm
Problem with me is I never keep track if my KLSE stocks are making gains. Only border with total wealth (which is wrong). Care to recommend any software for easy tracking. Currently 50% on ASNB, 10% cash, 5% KLSE, 5% private equity. If after GE no severe drop, will put cash-in-hand into low PE market like China, KLSE PE a bit high.
*
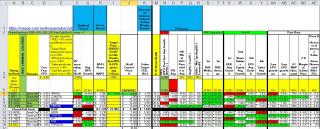
Heheh - i'm using simple old Excel (with several donkey years of customizing for easy triggering screen + tracking screens). No fancy software bro MGM. I can share a template for:
a. funds
5 sheets
worksheet that reads PM's website & Pru website for NAV
worksheet that holds the values & % held by categories - type of funds (Equities or Bonds) and via (Cash or EPF)
worksheet that holds the summary for each fund and using website worksheet's date & NAV
worksheet for tracking held details and using summary's date & NAV
worksheet for tracking switched/redeemed details and using summary's date & NAV

b. Stocks / REITs
3 sheets
worksheet that reads CSV exported from HLeB or Maybank - Equities
worksheet that reads CSV exported from HLeB or Maybank - REITs
worksheet for tracking held details, dividends & sold


This post has been edited by wongmunkeong: Jan 19 2012, 03:50 PM
wongmunkeong
post Jan 19 2012, 04:39 PM

Barista FIRE
Group Icon
Elite
5,608 posts

Joined: May 2011
From: Here, There, Everywhere


QUOTE(MGM @ Jan 19 2012, 03:56 PM)
Bro Wong, very good timing to start in 2009. Can see that most of your funds makes money. Profits % shown are after sales charge of 5%?
I notice that all are PM funds, why buy thru sales agent? Might as well buy as an PM agent.
2011 was a bad year for most funds, did u manage to make net gain too?
*
Hehhe - i AM registered as a PM agent since 2008 as i find that PM has enough above average equities and bond funds for me. Like i mentioned earlier somewhere, holistically (Supply Chain thinking), i switch between Equities & Bonds. Thus, lower costs in long term. Need only "good enough" funds from both types, needn't best of the best biggrin.gif/
That's how i did my back-testing for PM's funds (huge amount of data & stats from their software) tongue.gif

Net profits shared relating to PM's funds in that particular post are after equity sales charges of :
5.5% for cash and 3% for EPF,
minus
agent's net commission ie. commission (say cash 2.75% or EPF 1.75%) * 72% to 74% (my tax rate's 26% to 28% depending on which year).
Thus, effectively my cost is about 3.5%+/- for cash & 1.7%+/- for EPF for PM's Equity funds.

For Prudential's SmallCap, i paid full service charges.

2011?
Entries done in 2011 (based on my per transaction tracking) are mostly negative except for end 2011's entries (TwinVest and Trend), which are making and those are bigger $ sum transactions, especially the Trend entries sweat.gif
Only bond funds are nice looking for all entries in 2011.
Just to clarify - the %pa i shared earlier takes into account all the entries' transaction date & amount VS current value.

Personal opinion, i'm not too flustered about 2011 - win some, lose some, main thing is win more % & $ quantum than lose. That's where TwinVest & opportunistic Value/Trend helps me.

BIG BIG clarifications ar - my intention to share all these are not for selling methodologies nor even mutual funds. I'm just sharing what works for me. notworthy.gif

This post has been edited by wongmunkeong: Jan 19 2012, 04:49 PM
wongmunkeong
post Jan 19 2012, 05:11 PM

Barista FIRE
Group Icon
Elite
5,608 posts

Joined: May 2011
From: Here, There, Everywhere


QUOTE(MGM @ Jan 19 2012, 04:59 PM)
Sifu Wong, thanks for sharing.
*
You're welcome + i'm no seafood. Still learning or plenty of learning to go
I just hope i didnt confuse the kaka out of U and fellow forumers notworthy.gif

wongmunkeong
post Jan 19 2012, 06:30 PM

Barista FIRE
Group Icon
Elite
5,608 posts

Joined: May 2011
From: Here, There, Everywhere


QUOTE(transit @ Jan 19 2012, 05:53 PM)
Thanks for Wong for sharing. If Wong is working in my agency, then most of my UTC will be expert to using those data sharing. I like the way he creates those working methods with data pulling from CAMS & FP Advisor into Excel Spreadsheet. Thanks again...Hope year 2012 is a good ending....unlike year 2011 like a roller coaster trend. (High --> Low --> High)

Wishing all Happy CNY 2012 and more more $$$$$$$$ from your investment portfolio.
*
Paiseh paiseh - most probably if i'm in your agency, Transit, most of your UTCs wont even know i exist coz i seldom join my upline's group for talks/roadshow/etc. Actually, havent even joined once! tongue.gif
Only go for classes and that is just to get the donkey points to keep being an agent laugh.gif
Thus, i'm a bad example of a UTC in such light notworthy.gif

To those celebrating Chinese New Year - Prosperity and REAL WEALTH (always enough $ * great health * great relations) to U & your loved ones. rclxm9.gif


Added on January 19, 2012, 7:05 pmSifus and Guru-jis here, can i pick your brains?
Please do take a look at the attached concepts and shoot/criticize with feedback on how to make better can ar? These are some of the concepts / ideas / opinions i share with my friends and investors (now crystalized on Power Point) - again, not for selling per se, but to build a base of knowledge and understanding, even before thinking of investing.

Any legal-ese advise would be welcomed too - heck, i dont want to get into trouble sharing opinion / concepts / ideas tongue.gif

Danke in advance notworthy.gif
Attached File  To_Share___Simplify.zip ( 299.49k ) Number of downloads: 129


This post has been edited by wongmunkeong: Jan 19 2012, 08:28 PM
wongmunkeong
post Jan 19 2012, 09:56 PM

Barista FIRE
Group Icon
Elite
5,608 posts

Joined: May 2011
From: Here, There, Everywhere


QUOTE(jutamind @ Jan 19 2012, 09:45 PM)
i was looking through your files and one of your criteria for stock selection is share price <= discounted intrinsic value. how do you get the data for discounted intrinsic value?
*
Based on calculations using Avg EPS Growth, Avg P/E, Avg Dividends, Total Returns, then discounting it by xx%. The EPS, DPS, etc. are taken from that KLSE book in my notes - lots of historical stats (EPS, DPS, P/Es, DYs, etc) + 3 years ratios.

Heheh - formula based on a book i read. I gotta go dig it out to recall the name - it's either the local book with the title like "Make $ in the Stock Market in Up or Down markets" (or was it the other one.. read 2 good books locally written) or Rule #1 by Phil T. If U really interested in the formula, let me know - i'll go dig out the book and compare to my Excel's formulas, then let U know.

Sorry ar - getting old & foggy, read those books like in 2002 or so, built the Excel 2003 or so - if i recall correctly tongue.gif

This post has been edited by wongmunkeong: Jan 19 2012, 10:05 PM
wongmunkeong
post Jan 20 2012, 08:15 AM

Barista FIRE
Group Icon
Elite
5,608 posts

Joined: May 2011
From: Here, There, Everywhere


QUOTE(jutamind @ Jan 20 2012, 12:02 AM)
U mean the book by Ho Kok Mun? I got the book  as well.

Once you've filtered through the stocks, how do you determine buy and sell price?
*
Er.. i think so - i recognize his name biggrin.gif

Once filtered for at least 3 years consistency in ROE, D/E, Cashflow, etc
+ Create trigger prices to buy in
eg. MIN(discounted intrinsic value, margin of safety)
OR discounted Price/NAPS
OR Gross DY%
OR discounted P/E

Trigger to sell: Simple Trailing Stop Loss of 10%

Attached Image

Attached Image

oh.. kaka.. sorry ar mods & admin, now only noticed i'm replying in a Funds thread doh.gif
Jutamind - if more Qs, please post at Personal Financial Planning/Mgt (correct thread ar Mods & Admins? more fundamental approach than trading / TA in the Stocks area notworthy.gif )

This post has been edited by wongmunkeong: Jan 20 2012, 08:16 AM
wongmunkeong
post Jan 26 2012, 07:52 PM

Barista FIRE
Group Icon
Elite
5,608 posts

Joined: May 2011
From: Here, There, Everywhere


QUOTE(jutamind @ Jan 26 2012, 07:37 PM)
assuming that i have a UT fund that has returns of 30% over 3 year period and its sales charge is 5%. what would be the annualized returns of the fund (simple calc will do)?

is it (30% - 5%)/3 or (30%/3) - 5%?
*
imho, (30%/3) - 5% would give U a true-er view as the sales charge should be minused from the base

Just a thought - 30% gross returns without taking into consideration of the 5% sales charges? how in the world does that calculation / report happen? Which fund house or investment gives such weird calculations/reports? I'm just curious tongue.gif

Usually, the easiest way for CAGR calc:

CAGR %pa = (Current Value / Cost)^(1/years) -1

Where:
current value = units * NAV (ie. redemption value / sell back value)
Cost = total cost for that transaction

wongmunkeong
post Jan 26 2012, 08:38 PM

Barista FIRE
Group Icon
Elite
5,608 posts

Joined: May 2011
From: Here, There, Everywhere


QUOTE(jutamind @ Jan 26 2012, 08:11 PM)
oh...that was my hypothetical returns smile.gif

as for CAGR% calculation, how do u calculate if u have DCA? this will mean the current value & cost will always change every month...
*
Sodeska... thought which fund house that crazy trying to confuse its customers tongue.gif

Yup, calculate by per transaction (simple in Excel - copy & paste)
OR
if U have Microsoft Excel, try using the XIRR function for "group / fund" returns calculation.

This post has been edited by wongmunkeong: Jan 26 2012, 08:39 PM

13 Pages « < 4 5 6 7 8 > » Top
Topic ClosedOptions
 

Change to:
| Lo-Fi Version
0.0644sec    0.61    7 queries    GZIP Disabled
Time is now: 13th December 2025 - 08:30 PM