QUOTE(ozak @ Oct 26 2009, 08:19 AM)
I get this from chart advisor. What does it mean? Very deep financial language for me.

well, sprinting on treadmill means a person running on the track mesin in fitness first
wat is the difference if u go joggin at ur taman or fitness first?
in ur taman, u can move from point a to point b, the timing or distance depends on ur speed (speed=energy=volume=buying power)
on track mesin, u remain at point a, no matter how fast u run, so u feel tired, but at end, remains there
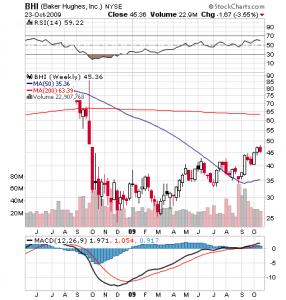
eg. bhi, so much volume but so slow price moves
"The best analogy I can think of for the markets this week is that they have been sprinting on a treadmill. There were some volatile moves back and forth, but in the end, the markets ended up going nowhere."
eg. expe, refer the volume & compare price movement with this. so they wonder y no see this

"The promising breakouts from last week have basically stalled, although most of the indexes remain above their breakout areas.". "There are some clear signals of weakness appearing in the markets, but as of yet there is still not a valid reversal signal. The market remains above prior support and in a near-term lateral range. This coming week should offer additional clues."
eg. refer clw, it has broken out, but stil cannot be push higher yet, so this week wil hav some idea on its movement
"If the indexes fail their breakouts, they could be in for a more prolonged consolidation or lateral trading range. The key level on the downside remains the September lows; if these are breached, it could signal a more protracted correction."
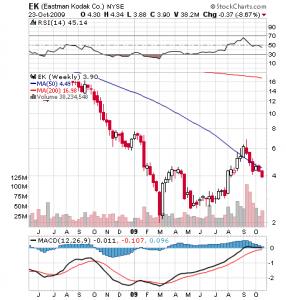
eg. ek breakout $4 with high volume. next breakout is to breach $6 level. however looking at chart, seems wil range trade. if not, can go lower to $3


 Oct 26 2009, 09:48 AM


 Quote
Quote


 care to share


 0.0310sec
 1.60
1.60
 6 queries
 GZIP Disabled