

QUOTE(David83 @ Oct 10 2016, 09:51 PM)
Paper gain.

Damn, no wonder all this while I was like "oh, people do actually take profit quite often? so nice they are already financially free and rely only on FSM to cover expenses every month"Fundsupermart.com v15, 基金超市第十五章 - Rise the Dragon
|
|
 Oct 10 2016, 09:55 PM Oct 10 2016, 09:55 PM
|

Junior Member
200 posts Joined: Mar 2015 |
QUOTE(David83 @ Oct 10 2016, 09:51 PM) Paper gain. Damn, no wonder all this while I was like "oh, people do actually take profit quite often? so nice they are already financially free and rely only on FSM to cover expenses every month" |
|
|
|
|
|
Oct 10 2016, 10:02 PM
|

Senior Member
5,272 posts Joined: Jun 2008 |
QUOTE(_azam13 @ Oct 10 2016, 09:55 PM) Damn, no wonder all this while I was like "oh, people do actually take profit quite often? so nice they are already financially free and rely only on FSM to cover expenses every month" lol most of us here tok kok and sing song most of the time. fsm is just a side hobby. unless you invested nearly a million in fsm. 2% is nothing as per se with most of the beliefs here. well it makes you feel good that you are doing something with your money. tongue in cheek comment. don't take it srius |
|
|
Oct 10 2016, 10:19 PM
|

All Stars
33,677 posts Joined: May 2008 |
QUOTE(David83 @ Oct 10 2016, 09:29 PM) Two funds are keep on struggling in my portfolio: Just double confirm. Cimb dynamite you mean Ponzi 2.0 ?1. Eastspring Investments Asia Pacific Ex-Japan Target Return Fund 2. Kenanga Asia Pacific Total Return Fund A little regret for selling off CIMB Dynamite but since I have similar fund in my PRS holdings. Don't really feel the "pain". LOL That's everybody's top lover. |
|
|
Oct 10 2016, 10:26 PM
|
|
Senior Member
5,272 posts Joined: Jun 2008 |
QUOTE(puchongite @ Oct 10 2016, 10:19 PM) Just double confirm. Cimb dynamite you mean Ponzi 2.0 ? didn't it do very badly? donno I switched it off to another fundThat's everybody's top lover. |
|
|
Oct 10 2016, 10:33 PM
|
|
All Stars
52,874 posts Joined: Jan 2003 |
QUOTE(puchongite @ Oct 10 2016, 10:19 PM) Just double confirm. Cimb dynamite you mean Ponzi 2.0 ? Yes. Ponzi 2.0That's everybody's top lover. QUOTE(Avangelice @ Oct 10 2016, 10:26 PM) didn't it do very badly? donno I switched it off to another fund Used to be on the first half of 2016.But in the last 3 months, it looks like it is on steroid. Somebody did comment on this yesterday or today. |
|
|
Oct 10 2016, 10:35 PM
|

Senior Member
1,166 posts Joined: Jul 2016 |
QUOTE(Avangelice @ Oct 10 2016, 10:26 PM) didn't it do very badly? donno I switched it off to another fund I guess timing in entering the market is also a factor.If I strip off my initial APDIF investment, just by same 2 RSP contribution timing for both APDIF and AIF, APDIF ROI significantly outperform AIF ROI by 2% in less then 2 months investment Kinda insignificant but thats my experience (might need longer time to verify  ) ) |
|
|
|
|
|
Oct 10 2016, 10:38 PM
|
|
Senior Member
1,166 posts Joined: Jul 2016 |
QUOTE(David83 @ Oct 10 2016, 10:33 PM) Yes. Ponzi 2.0 If lump sum, then it will be affected by the first half year drag down.Used to be on the first half of 2016. But in the last 3 months, it looks like it is on steroid. Somebody did comment on this yesterday or today. If one DCA/RSP instead, they will gain a lot Of course, if you only invest lump sum when you know when it rebounce, you will earn most but is impractical This post has been edited by AIYH: Oct 10 2016, 10:39 PM |
|
|
Oct 10 2016, 10:40 PM
Show posts by this member only | IPv6 | Post
#1348
|
|
Junior Member
463 posts Joined: Nov 2007 |
QUOTE(AIYH @ Oct 10 2016, 10:35 PM) I guess timing in entering the market is also a factor. APDIF will not doing well recently due to Thailand political issue and recent or sooner fed decision, still have chance to go in or top up..its 5 star region (asia). Do note also the recently Brazil on steroid...up up brazil, up up emerging /bric..If I strip off my initial APDIF investment, just by same 2 RSP contribution timing for both APDIF and AIF, APDIF ROI significantly outperform AIF ROI by 2% in less then 2 months investment Kinda insignificant but thats my experience (might need longer time to verify ) |
|
|
Oct 10 2016, 11:17 PM
Show posts by this member only | IPv6 | Post
#1349
|
|
Senior Member
5,272 posts Joined: Jun 2008 |
QUOTE(wayne84 @ Oct 10 2016, 10:40 PM) APDIF will not doing well recently due to Thailand political issue and recent or sooner fed decision, still have chance to go in or top up..its 5 star region (asia). Do note also the recently Brazil on steroid...up up brazil, up up emerging /bric.. heads up the king of Thailand may pass on very soon and the junta may be going back into civil war. you can buy in after the death of the kind and the subsequent military fall out. |
|
|
Oct 10 2016, 11:21 PM
|
|
Senior Member
5,143 posts Joined: Jan 2015 |
QUOTE(Avangelice @ Oct 10 2016, 11:17 PM) heads up the king of Thailand may pass on very soon and the junta may be going back into civil war. FSM MY don't have Thailand focused fund.you can buy in after the death of the kind and the subsequent military fall out. CIMB APDIF has only 6.5% in it... not much impact to the fund... any idea what fund is heavier on Thailand? This post has been edited by T231H: Oct 10 2016, 11:22 PM |
|
|
Oct 10 2016, 11:25 PM
|

Senior Member
4,726 posts Joined: Jul 2013 |
QUOTE(David83 @ Oct 10 2016, 09:29 PM) Two funds are keep on struggling in my portfolio: if i'm remembered correctly (i'm not stalker) but you got the Kenanga AP fund around the time where the market dropped like **** last year, before april 2015? it will require some time to "earn" back. 1. Eastspring Investments Asia Pacific Ex-Japan Target Return Fund 2. Kenanga Asia Pacific Total Return Fund A little regret for selling off CIMB Dynamite but since I have similar fund in my PRS holdings. Don't really feel the "pain". LOL as for Eastspring AP, i bought the fund although i didn't top up from my initial investment. i'm actually looking to divest of this fund and move it to another fund. haha. Btw, i also bought into Libra Anita bond fund. |
|
|
Oct 10 2016, 11:43 PM
|
|
Senior Member
1,166 posts Joined: Jul 2016 |
QUOTE(T231H @ Oct 10 2016, 11:21 PM) FSM MY don't have Thailand focused fund. CIMB-Principal ASEAN Total Return Fund -Class MYR (launched 1.5 years) (13.6% Thailand Equity)CIMB APDIF has only 6.5% in it... not much impact to the fund... any idea what fund is heavier on Thailand? AFFIN HWANG ASEAN FLEXI FUND - MYR CLASS (launched 2 years) (28% Thailand Equity) AMASEAN EQUITY (launched around the same time with APDIF) (19.46% Thailand Equity) YTD performance comparison with APDIF, what do you think?  This post has been edited by AIYH: Oct 10 2016, 11:52 PM Attached thumbnail(s) 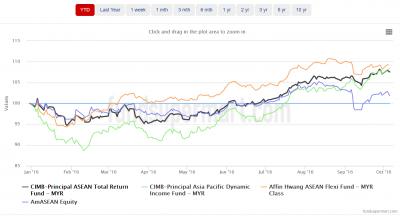
|
|
|
Oct 10 2016, 11:54 PM
|
|
Senior Member
5,143 posts Joined: Jan 2015 |
QUOTE(AIYH @ Oct 10 2016, 11:43 PM) CIMB-Principal ASEAN Total Return Fund -Class MYR (launched 1.5 years) (13.6% Thailand Equity) thanks for the input.... AFFIN HWANG ASEAN FLEXI FUND - MYR CLASS (launched 2 years) (28% Thailand Equity) YTD performance comparison with APDIF, what do you think?  I think I will stick with CIMB APDIF....at just 6.5% else may have overexposure to other Asean countries if take in another CIMB ATRF for the benefits of 2x in Thailand. the hwang one is a Balanced fund.....not thinking of having a balanced fund for now.... |
|
|
|
|
|
Oct 10 2016, 11:56 PM
|
|
Senior Member
1,166 posts Joined: Jul 2016 |
QUOTE(T231H @ Oct 10 2016, 11:54 PM) thanks for the input.... Actually still got more, can dig out, quite some fund have double digit allocation in Thailand I think I will stick with CIMB APDIF....at just 6.5% else may have overexposure to other Asean countries if take in another CIMB ATRF for the benefits of 2x in Thailand. the hwang one is a Balanced fund.....not thinking of having a balanced fund for now.... Affin one is balanced, but in fund fact sheet, only 4.1% bond, which is Genting SG PLC Bond, the sole bond in the fund, and is maturing within a year, balanced? This post has been edited by AIYH: Oct 11 2016, 12:00 AM |
|
|
Oct 11 2016, 12:02 AM
|
|
Senior Member
5,143 posts Joined: Jan 2015 |
QUOTE(AIYH @ Oct 10 2016, 11:56 PM) Actually still got more, can dig out, quite some fund have double digit allocation in Thailand from the annual report......saw this..... Affin one is balanced, but in fund fact sheet, only 4.1% bond, which is Genting SG PLC Bond, the sole bond in the fund, and is maturing within a year, balanced?  Attached thumbnail(s) 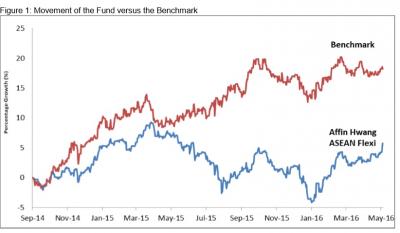
|
|
|
Oct 11 2016, 12:08 AM
|
|
Senior Member
1,166 posts Joined: Jul 2016 |
QUOTE(T231H @ Oct 11 2016, 12:02 AM) from the annual report......saw this..... Every fund has different benchmark to measure, like CIMB APDIF using 8% p.a. as benchmark, the comparison can mean something and mean nothing depending on the context and target. For Thailand equity double digit allocation compilation: CIMB-Principal ASEAN Total Return Fund -Class MYR (launched 1.5 years) (13.6% Thailand Equity) AFFIN HWANG ASEAN FLEXI FUND - MYR CLASS (launched 2 years) (28% Thailand Equity) AMASEAN EQUITY (launched around the same time with APDIF) (19.46% Thailand Equity) Kenanga ASEAN Tactical Total Return Fund (launched 1.25 years ago) (17.3% Thailand Equity) RHB ASEAN FUND (launched 7 years ago) (14.3% Thailand Equity) YTD performance comparison with APDIF, kinda in sync, but each fund have different other allocation, just take it as a grain of salt  But from the graph, you can see that, as you and many said, if you got steel balls and DCA/RSP all the way, APDIF will net you higher return This post has been edited by AIYH: Oct 11 2016, 12:10 AM Attached thumbnail(s) 
|
|
|
Oct 11 2016, 12:13 AM
|
|
Senior Member
5,143 posts Joined: Jan 2015 |
QUOTE(AIYH @ Oct 11 2016, 12:08 AM) .... But from the graph, you can see that, as you and many said, if you got steel balls and DCA/RSP all the way, APDIF will net you higher return   Ponzi 2.0 Ponzi 2.0  |
|
|
Oct 11 2016, 06:52 AM
|
|
All Stars
52,874 posts Joined: Jan 2003 |
QUOTE(adele123 @ Oct 10 2016, 11:25 PM) if i'm remembered correctly (i'm not stalker) but you got the Kenanga AP fund around the time where the market dropped like **** last year, before april 2015? it will require some time to "earn" back. I bought Kenanga APTRF on April 2015 and Eastspring APTRF on November 2014. as for Eastspring AP, i bought the fund although i didn't top up from my initial investment. i'm actually looking to divest of this fund and move it to another fund. haha. Btw, i also bought into Libra Anita bond fund. I did a couple of top up during major downtime. LOL Even used to be pathetic Affin Hwang Select Asia (Ex Japan) Opportunity Fund also outperforms these two. This post has been edited by David83: Oct 11 2016, 07:20 AM |
|
|
Oct 11 2016, 09:10 AM
|

Senior Member
2,081 posts Joined: Mar 2012 |
QUOTE(David83 @ Oct 10 2016, 10:33 PM) Yes. Ponzi 2.0 Wah. Now even got CIMB DYNAMITE.Used to be on the first half of 2016. But in the last 3 months, it looks like it is on steroid. Somebody did comment on this yesterday or today. Last time we used to have AmDynamite. Hahaha.. Old timer will know |
|
|
Oct 11 2016, 09:22 AM
|
|
All Stars
52,874 posts Joined: Jan 2003 |
QUOTE(TakoC @ Oct 11 2016, 09:10 AM) Wah. Now even got CIMB DYNAMITE. That one is AmDynamite Bond FundLast time we used to have AmDynamite. Hahaha.. Old timer will know This is one CIMB Dynamite Equity Fund We also got Ponzi 1 and Ponzi 2, Titanic Fund, Aladdin Fund, Evergreen Fund and lastly, Anita Mui Bond Fund. Those what I can recall from my stacking memory. LOL |
|
Topic ClosedOptions
|
| Change to: |  0.0180sec 0.0180sec
 0.62 0.62
 6 queries 6 queries
 GZIP Disabled GZIP Disabled
Time is now: 12th December 2025 - 08:15 AM |
 Quote
Quote