Welcome Guest ( Log In | Register )

69 Pages « < 47 48 49 50 51 > » Bottom

Outline · [ Standard ] · Linear+

 STPM 2014/2015

views
     
Critical_Fallacy
post Apr 13 2015, 09:16 PM

∫nnộvisεr
Group Icon
VIP
3,713 posts

Joined: Nov 2011
From: Torino
QUOTE(scgoh123 @ Apr 13 2015, 07:00 PM)
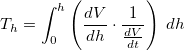
The problem that i had faced is when I tried to substitute h=14 into the differential equation that I have obtained, the time taken is infinity. The container will never be filled. So how do I calculate the time taken to fill up the container?
Was that really a problem? hmm.gif

I believe that I've given an explanation in the previous post.

You could check your answer for h = 13.9 m and h = 13.99 m, to test the convergence of the result . icon_idea.gif

To make the problem more interesting, the parameters in part 2(b) should be chosen carefully k = 28 and n = 0.5, as both take roughly the same time (15.2 hours) to fill up the container up to the water level 13.9 m. But the nonlinear control mechanism in 2(b) will fill up the container 100% by 17 hours.

user posted image

In reality, the process will be terminated (turn off the valve) if time taken to fill the container exceeds the expected time. The MRO (maintenance, repair, and overhaul) team will carry out the Fault Detection and Diagnosis manually on the system. Modern systems usually have the Fault-Tolerant Control System installed to minimize downtime of a system.

This post has been edited by Critical_Fallacy: Apr 13 2015, 09:39 PM
TSscgoh123
post Apr 14 2015, 08:59 PM

【鬼の隠し拳:天地ガエシ】
*****
Senior Member
846 posts

Joined: Jun 2014
From: Reality-escaping 2D world
QUOTE(Critical_Fallacy @ Apr 13 2015, 03:33 PM)
scgoh123

For 2(b), I've got this. The max (1.22 m/hr) occurs around the bottleneck (8.36 m) of the Hyperboloid Container. Does it make sense to you? sweat.gif

user posted image

When you get user posted image, it all goes back to the quadratics. laugh.gif

user posted image

For your info, the dh/dt does not have a minimum in the calculus sense, but it contains an Infimum, which is the greatest lower bound on h ∈ [0, 14]. You can imagine that, as the water level is approaching 14 m, the flow rate dV/dt ≈ 0, causing the water level to increase extremely slow (to prevent overflow), and therefore dh/dt ≈ 0. It is inaccurate to put exactly dh/dt = 0, because that means the flow control valve is turned off completely (dV/dt = 0). Since dV/dh is non-zero, the Chain Rule becomes indeterminate. The argument of 2(b) is built on the assumption that the water is being pumped continuously into the cooling tower until it stops at the water level 14 m. Naturally, when you stop pumping water, the water level stops increasing.

Please note that in this case, the maximum is also the Supremum (the least upper bound) of the set.
*
Yes it does make sense. Thanks biggrin.gif
I have plotted the graph in wolfram mathematica, but how to show the coordinates of maximum point in the graph?


This post has been edited by scgoh123: Apr 14 2015, 09:13 PM
TSscgoh123
post Apr 14 2015, 09:02 PM

【鬼の隠し拳:天地ガエシ】
*****
Senior Member
846 posts

Joined: Jun 2014
From: Reality-escaping 2D world
QUOTE(Critical_Fallacy @ Apr 13 2015, 02:56 PM)
For 2(b), using the Chain Rule, user posted image, find

(i). user posted image

(ii). user posted image

Since user posted image is given and user posted image can be obtained from the derivative of 1(b), the rest is Algebra and you can find the extrema on the closed interval user posted image.

For completeness, you should also determine the height of the water level at which the minimum and maximum of dh/dt occur. icon_rolleyes.gif
*
Does this means that the time taken to fill up the hyperboloid container to almost full but not full?
Honestyrules
post Apr 14 2015, 09:56 PM

New Member
*
Junior Member
7 posts

Joined: Mar 2015
Hi , just wondering does anybody know when does form 6 start for 2015? this year? Any ideas?
stickmanchong17
post Apr 14 2015, 11:59 PM

Casual
***
Junior Member
359 posts

Joined: Mar 2014


QUOTE(Honestyrules @ Apr 14 2015, 09:56 PM)
Hi , just wondering does anybody know when does form 6 start for 2015? this year? Any ideas?
*
it will usually be in May~
Just Visiting By
post Apr 15 2015, 12:02 AM

Regular
******
Senior Member
1,846 posts

Joined: May 2013


QUOTE(Honestyrules @ Apr 14 2015, 09:56 PM)
Hi , just wondering does anybody know when does form 6 start for 2015? this year? Any ideas?
*
Form 6 enrollment begins around 8 of May every year.

However, it depends on the school whether to hold orientation till June, or to begin learning session immediately.

Your first semester officially commences June.
Critical_Fallacy
post Apr 15 2015, 01:50 PM

∫nnộvisεr
Group Icon
VIP
3,713 posts

Joined: Nov 2011
From: Torino
QUOTE(scgoh123 @ Apr 14 2015, 08:59 PM)
Yes it does make sense. Thanks biggrin.gif
I have plotted the graph in wolfram mathematica, but how to show the coordinates of maximum point in the graph?
In Mathematica, the maximum of an expression that is a function of one variable can be found with

CODE
FindMaximum[{expr [x]},{x,xo,xl,xu}]


where expr is a function of x, xo is the initial guess for the search for the minimum or maximum, xl is the lower bound for the search region, and xu is the upper bound for the search region. Both xl and xu are optional.

If you use WolframAlpha online, just type:

CODE
turning point [expr]


Then, move your mouse cursor to the red dot to display the coordinates. And that's for the first graph. icon_idea.gif

user posted image

This post has been edited by Critical_Fallacy: Apr 15 2015, 01:52 PM
Honestyrules
post Apr 15 2015, 02:00 PM

New Member
*
Junior Member
7 posts

Joined: Mar 2015
QUOTE(Just Visiting By @ Apr 15 2015, 12:02 AM)
Form 6 enrollment begins around 8 of May every year.

However, it depends on the school whether to hold orientation till June, or to begin learning session immediately.

Your first semester officially commences June.
*
Hi thank you for the response . First semester starting in june? The check in date is on 5th May . So will I be starting my school teaching and learning lessons around May or June?
Critical_Fallacy
post Apr 15 2015, 04:03 PM

∫nnộvisεr
Group Icon
VIP
3,713 posts

Joined: Nov 2011
From: Torino
QUOTE(scgoh123 @ Apr 14 2015, 09:02 PM)
Does this means that the time taken to fill up the hyperboloid container to almost full but not full?
The linear control mechanism in 2(a) fails to fill up the water level of the tank to 100% because the amount of water it pumps into the tank is insufficient to increase the height of the water level significantly.

It is important to comment on the physical meaning of linear control mechanism, where the flow rate is linearly proportional to measured water level error Δh = (14 - h). As the height of the water level is approaching 14 m, the error signal is greatly reduced Δh ≈ 0, causing the flow rate is throttled to a state where it causes an infinitesimal increase in the water level (e.g. 13.9 m + 0.09 + 0.009 + ...), and it never reach the full tank height.

Technically, this doesn't cause overflow, but is undesirable because the water pump seems to be in perpetual operation (causing the acceleration of wear and tear, and not energy-efficient). Of course, the control system can add a constraint to terminate the pump by installing a simple fail-safe sensor at 13.9 m, if the 0.1 m does not have a significant impact on the commercial side.

user posted image
TSscgoh123
post Apr 15 2015, 10:25 PM

【鬼の隠し拳:天地ガエシ】
*****
Senior Member
846 posts

Joined: Jun 2014
From: Reality-escaping 2D world
QUOTE(Critical_Fallacy @ Apr 15 2015, 02:50 PM)
In Mathematica, the maximum of an expression that is a function of one variable can be found with

CODE
FindMaximum[{expr [x]},{x,xo,xl,xu}]


user posted image
*
Yeah I've used this method, but I can't pinpoint to maximum point on the graph. What's wrong with this?
user posted image

This post has been edited by scgoh123: Apr 15 2015, 10:26 PM
TSscgoh123
post Apr 15 2015, 10:29 PM

【鬼の隠し拳:天地ガエシ】
*****
Senior Member
846 posts

Joined: Jun 2014
From: Reality-escaping 2D world
QUOTE(Honestyrules @ Apr 15 2015, 03:00 PM)
Hi thank you for the response . First semester starting in june? The check in date is on 5th May . So will I be starting my school teaching and learning lessons around May or June?
*
Depends on the school that you're enrolled in. Usually you will start off with Orientation week.
Critical_Fallacy
post Apr 16 2015, 03:00 PM

∫nnộvisεr
Group Icon
VIP
3,713 posts

Joined: Nov 2011
From: Torino
QUOTE(scgoh123 @ Apr 15 2015, 10:25 PM)
Yeah I've used this method, but I can't pinpoint to maximum point on the graph. What's wrong with this?
user posted image
The command "FindMaximum[]" returns only the numerical values.

You should plot the numerical evaluation of the equation and then label the result by identifying its maximum value.

(* Find maximum *)

» Click to show Spoiler - click again to hide... «


(* Create labels *)

» Click to show Spoiler - click again to hide... «


(* Plot and annotate results *)

» Click to show Spoiler - click again to hide... «


As you can see, it's pretty systematic and tedious in a sense. sweat.gif A quick shortcut is to use the Tooltip[], which allows you to use a mouse pointer to display information about curves or data points when the mouse pointer is over a curve or a data point.

The use of computational software is probably beyond STPM. The proper way to find the maximum is to solve the following equation:

user posted image
ivy96
post Apr 17 2015, 06:50 PM

New Member
*
Junior Member
8 posts

Joined: Apr 2015


QUOTE(Krevaki @ Jul 1 2014, 04:48 PM)
This is actually the first time I heard about such a rule. sweat.gif
*
YEA.. me too... is that really the rule for stpm exampaper??
hmm.gif

TSscgoh123
post Apr 17 2015, 07:33 PM

【鬼の隠し拳:天地ガエシ】
*****
Senior Member
846 posts

Joined: Jun 2014
From: Reality-escaping 2D world
QUOTE(Critical_Fallacy @ Apr 16 2015, 04:00 PM)
The command "FindMaximum[]" returns only the numerical values.

You should plot the numerical evaluation of the equation and then label the result by identifying its maximum value.

(* Find maximum *)

» Click to show Spoiler - click again to hide... «


(* Create labels *)

» Click to show Spoiler - click again to hide... «


(* Plot and annotate results *)

» Click to show Spoiler - click again to hide... «


As you can see, it's pretty systematic and tedious in a sense. sweat.gif  A quick shortcut is to use the Tooltip[], which allows you to use a mouse pointer to display information about curves or data points when the mouse pointer is over a curve or a data point.

The use of computational software is probably beyond STPM. The proper way to find the maximum is to solve the following equation:

user posted image
*
It's quite tedious, actually. Thanks for solving this problem! This really helps a lot~
ivy96
post Apr 17 2015, 08:06 PM

New Member
*
Junior Member
8 posts

Joined: Apr 2015


QUOTE(RED-HAIR-SHANKS @ Feb 12 2015, 03:42 AM)
Just a quick question here concerning PA graph:-
Suppose that I get a question that has passages which sound like this:''...kadar peningkatan penduduk Cina meningkat kepada 20 ribu pada tahun 2007...'' or ''...jumlah penduduk bumiputera dalam tempoh 5 tahun tersebut hanya meningkat menjadi 120 ribu pada tahun 2012...''. Now, if I were to plot the y-axis of the graph, should it be like 20000, 40000,60000,80000... for every 2 cm, or 20, 40, 60,80,... for every 2 cm and finally add a ('000 penduduk) when labeling the y-axis?

And having said that, what should we write for our skala? 1 cm:10000 penduduk, or 1 cm: 10 ribu penduduk?
*
my teacher said its better to follow your text..
this bcoz the "skema" exampaper, may accept & maybe not..
so to be safe,, follow directly on text..
and additonal info, 'salah media' will directly be jugde by your table..
and the max marks is 3 only..
(this by my own experience) smile.gif
ivy96
post Apr 17 2015, 08:22 PM

New Member
*
Junior Member
8 posts

Joined: Apr 2015


QUOTE(RED-HAIR-SHANKS @ Feb 26 2015, 07:42 PM)
Just Visiting By, do we have to always state the definisi in the pengenalan(first paragraph) of our PA essay?
*
my tc said.. its better not..
bcause, if your 'definisi' incorrect, it may effect the mark..
TSscgoh123
post Apr 22 2015, 10:22 PM

【鬼の隠し拳:天地ガエシ】
*****
Senior Member
846 posts

Joined: Jun 2014
From: Reality-escaping 2D world
QUOTE(ivy96 @ Apr 17 2015, 09:06 PM)
my teacher said its better to follow your text..
this bcoz the "skema" exampaper, may accept & maybe not..
so to be safe,, follow directly on text..
and additonal info, 'salah media' will directly be jugde by your table..
and the max marks is 3 only..
(this by my own experience) smile.gif
*
I agree with that, even though your summations of data given is not tally with the sum given in the question....... (I saw this in past year papers)
TSscgoh123
post Apr 22 2015, 10:26 PM

【鬼の隠し拳:天地ガエシ】
*****
Senior Member
846 posts

Joined: Jun 2014
From: Reality-escaping 2D world
RED-HAIR-SHANKS Are you there...? Long time I haven't heard replies from you.
TSscgoh123
post Apr 28 2015, 05:10 PM

【鬼の隠し拳:天地ガエシ】
*****
Senior Member
846 posts

Joined: Jun 2014
From: Reality-escaping 2D world
Anyone had finished 2nd Term trial exam? Can anyone upload their papers here? I will be uploading mine soon.
TSscgoh123
post Apr 28 2015, 05:14 PM

【鬼の隠し拳:天地ガエシ】
*****
Senior Member
846 posts

Joined: Jun 2014
From: Reality-escaping 2D world
Just Visiting By Can I ask a question regarding PA graphs?
I saw a word 'unjuran' in STPM 2013(?) Ulangan Paper. What does this word means? And what type of graph should I draw if the question asks for 'unjuran permintaan komoditi makanan utama pada tahun 2010 hingga 2020 (anggaran)'?

69 Pages « < 47 48 49 50 51 > » Top
 

Change to:
| Lo-Fi Version
0.0244sec    0.52    6 queries    GZIP Disabled
Time is now: 21st December 2025 - 09:57 AM