

 Oct 22 2009, 11:12 PM

QUOTE(mynewuser @ Oct 22 2009, 07:56 PM)
TA cannot use in DJI.


so how do we play dji then?
Added on October 22, 2009, 11:21 pm
QUOTE(redken @ Oct 22 2009, 06:10 PM)
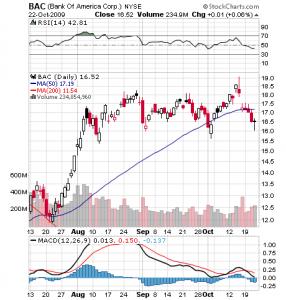
If falling below long term MA its time to buy already. U should sell before it breach long term MA threshold coz from there onwards, its gonna freefall. If its approaching long term MA from below, then its time to sell, the reverse is true.
hmm... that means 95% of my ramblings could not be understood 
ok, in future more pictures, less talking
if can, u got to try the theory & see how it fits to ur study plan
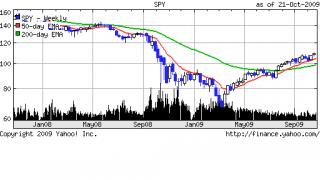
basically 50>200 means its in uptrend
u can note some charts, the price just above 50 & ride up along the trend
so 50<200 means downtrend
u can note some charts, the price just below 200 & ride down along the trend
see how is 50 trying to move, notis it tries to move up, while still under 200
refer dia, qqqq & spy chart. the candlesticks charts & volume is giving u some kind of a clue, where the support & resistance r located
dia = dow jones, qqqq = nasdaq & spy = s&p500
the key point to watch is when 50 intersect with 200 & vice versa, who will win the fight? bulls or bear. u can either wait for confirmation or gamble on its next path

This post has been edited by sulifeisgreat: Oct 22 2009, 11:48 PM
 Quote
Quote


 time to gulung tikar


 ...caveat emptor
 0.0264sec
 0.79
0.79
 6 queries
 GZIP Disabled