Welcome Guest ( Log In | Register )

Bump Topic Topic Closed RSS Feed
124 Pages « < 37 38 39 40 41 > » Bottom

Outline · [ Standard ] · Linear+

 FOREX TRADING HQ VER 4, Speculators, scalpers and traders wanted

views
     
small-jeff
post Oct 4 2008, 12:30 AM

Regular
******
Senior Member
1,646 posts

Joined: Jun 2007
QUOTE(mphpopular @ Oct 3 2008, 09:26 PM)
Guess there will be a retracement soon. Dont care la.. ALl TP and SL set. Is time to brush teeth and sleep jor.... Very tired d.

EDIt:
I'm not sure how the fundamental is interpreted, but if some one does notice on it. For every news come out whereby it should bring the USD down, but unnaturally, on the GU and EU pair, the up spike was juz within 1min, then the trend go bak down again.

What I do mean is, suppose a bad usd news bring EU go up, but mana tau, only spike up 1 min, then go downtrend again.

Wish I didn't say wrong, since I not really a fundamental guy.... Juz my small observation
*
hm...actually...the down move on EU makes sense. With the deteriorating situation in Europe, people would fear banks and firms will turn out just like US. Like mentioned earlier, money are going to US Treasuries (here), where the yield for longer terms have been rising lately. Ofcourse, this is one of the many places money could go. Like billy said, it's going to Yen as well.

As we've talked about last night, the price reached about 1/3 way towards the 74.6...while it's still hanging around back at the 61.8 area..based on TA alone, the bear is very weak on a daily outlook.

IMO, fundamentals aint about good print = up, bad print = down (in good times, of course yes). It's more about understanding where will the money go, especially important in forex. smile.gif
normeck
post Oct 4 2008, 12:31 AM

Look at all my stars!!
*******
Senior Member
3,158 posts

Joined: Dec 2006


where is Lowyat aaa?
jack2
post Oct 4 2008, 12:37 AM

Mr
********
All Stars
15,192 posts

Joined: Oct 2004
QUOTE(normeck @ Oct 4 2008, 12:31 AM)
where is Lowyat aaa?
*
lowyat busy to count pips drool.gif
kelvin_tan
post Oct 4 2008, 02:19 AM

Passion for Pipping!
*******
Senior Member
3,141 posts

Joined: Nov 2006


@dr2k3
i understand what you are trying to say.. but it is equally important to speculate the news outcome as there are times where a few (2-3)high impact news is released at the same time.. should all this turned out unfavourable.. the movement caused by this can easily hit ur stop losss (unless ur stop loss is like 200-300 pips)..
etfs_trader
post Oct 4 2008, 02:46 AM

New Member
*
Junior Member
37 posts

Joined: Jul 2008
this is today's income...got floating + for buy GU and sell UJ....

see u all next week


Attached thumbnail(s)
Attached Image
mphpopular
post Oct 4 2008, 04:30 PM

bar chartist
*******
Senior Member
2,214 posts

Joined: Oct 2007
EU


Added on October 4, 2008, 4:32 pm@anyone
If the Eu does occur the bump and run reversal. Where should be the technical target profit for Bump and RUn incident. I cant find any info about this in google.

This post has been edited by mphpopular: Oct 4 2008, 04:32 PM


Attached thumbnail(s)
Attached Image
victor131490
post Oct 4 2008, 07:59 PM

Casual
***
Junior Member
367 posts

Joined: Dec 2006
From: Ipoh


QUOTE(etfs_trader @ Oct 4 2008, 02:46 AM)
this is today's income...got floating + for buy GU and sell UJ....

see u all next week
*
wow nice profit. . .u using which broker? smile.gif
etfs_trader
post Oct 4 2008, 09:54 PM

New Member
*
Junior Member
37 posts

Joined: Jul 2008
i use sparenfx and MIG
kevler
post Oct 5 2008, 11:41 AM

trading in the zone
*******
Senior Member
2,939 posts

Joined: Oct 2004
From: localhost


Five Wave Pattern: Dominant Trend

Wave 1: Wave one is rarely obvious at its inception. When the first wave of a new bull market begins, the fundamental news is almost universally negative. The previous trend is considered still strongly in force. Fundamental analysts continue to revise their earnings estimates lower; the economy probably does not look strong. Sentiment surveys are decidedly bearish, put options are in vogue, and implied volatility in the options market is high. Volume might increase a bit as prices rise, but not by enough to alert many technical analysts.

Wave 2: Wave two corrects wave one, but can never extend beyond the starting point of wave one. Typically, the news is still bad. As prices retest the prior low, bearish sentiment quickly builds, and "the crowd" haughtily reminds all that the bear market is still deeply ensconced. Still, some positive signs appear for those who are looking: volume should be lower during wave two than during wave one, prices usually do not retrace more than 61.8% (see Fibonacci section below) of the wave one gains, and prices should fall in a three wave pattern.

Wave 3: Wave three is usually the largest and most powerful wave in a trend (although some research suggests that in commodity markets, wave five is the largest). The news is now positive and fundamental analysts start to raise earnings estimates. Prices rise quickly, corrections are short-lived and shallow. Anyone looking to "get in on a pullback" will likely miss the boat. As wave three starts, the news is probably still bearish, and most market players remain negative; but by wave three’s midpoint, "the crowd" will often join the new bullish trend. Wave three often extends wave one by a ratio of 1.618:1.

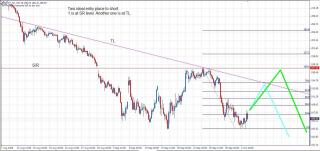
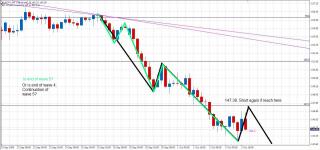
Wave 4: Wave four is typically clearly corrective. Prices may meander sideways for an extended period, and wave four typically retraces less than 38.2% of wave three. Volume is well below than that of wave three. This is a good place to buy a pull back if you understand the potential ahead for wave 5. Still, the most distinguishing feature of fourth waves is that they often prove very difficult to count.

Wave 5: Wave five is the final leg in the direction of the dominant trend. The news is almost universally positive and everyone is bullish. Unfortunately, this is when many average investors finally buy in, right before the top. Volume is lower in wave five than in wave three, and many momentum indicators start to show divergences (prices reach a new high, the indicator does not reach a new peak). At the end of a major bull market, bears may very well be ridiculed (recall how forecasts for a top in the stock market during 2000 were received).


Three Wave Pattern: Corrective Trend

Wave A: Corrections are typically harder toidentify than impulse moves. In wave A of a bear market, the fundamental news is usually still positive. Most analysts see the drop as a correction in a still-active bull market. Some technical indicators that accompany wave A include increased volume, rising implied volatility in the options markets and possibly a turn higher in open interest in related futures markets.

Wave B: Prices reverse higher, which many see as a resumption of the now long-gone bull market. Those familiar with classical technical analysis may see the peak as the right shoulder of a head and shoulders reversal pattern. The volume during wave B should be lower than in wave A. By this point, fundamentals are probably no longer improving, but they most likely have not yet turned negative.

Wave C: Prices move impulsively lower in five waves. Volume picks up, and by the third leg of wave C, almost everyone realizes that a bear market is firmly entrenched. Wave C is typically at least as large as wave A and often extends to 1.618 times wave A or beyond.


Added on October 5, 2008, 11:51 amuser posted image

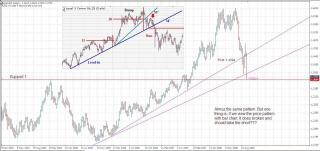
something we can ponder tomorrow wink.gif


EU will rallying to 1.32xx .. woohoo ....i need to subscribe CNN and CNBC later @Astro

This post has been edited by kevler: Oct 5 2008, 11:51 AM
mphpopular
post Oct 5 2008, 01:30 PM

bar chartist
*******
Senior Member
2,214 posts

Joined: Oct 2007
I love the 1.32xx.

This post has been edited by mphpopular: Oct 5 2008, 01:31 PM
slacker
post Oct 5 2008, 01:40 PM

Casual
***
Junior Member
404 posts

Joined: May 2005
New to forex here. Anyone can recommend me a regulated broker (NFA and CFTC) with MT4 trading platform offering micro lot demo account?

PS: Also with low entry deposit.

This post has been edited by slacker: Oct 5 2008, 01:40 PM
mphpopular
post Oct 5 2008, 04:07 PM

bar chartist
*******
Senior Member
2,214 posts

Joined: Oct 2007
We need another lower low (1.7435) by the end of coming this week to cr8 a bear trend again. If not, we might have the chance to go up back again...
By the way, I biased bear.


Attached thumbnail(s)
Attached Image Attached Image Attached Image
kelvin_tan
post Oct 5 2008, 05:26 PM

Passion for Pipping!
*******
Senior Member
3,141 posts

Joined: Nov 2006


technically yes.. but does the economical analysis agree with the TA ? if yes then we can short short short.. but i can't c why is GU going down as in my opinion, US is in a deep financial crisis while GBP isn't. Can anyone correct me ?
mphpopular
post Oct 5 2008, 05:31 PM

bar chartist
*******
Senior Member
2,214 posts

Joined: Oct 2007
I not sure about that, I basically in TA only. FA I langsung dunno.... Need you guys teach me jor.
TSAdamG1981
post Oct 5 2008, 05:35 PM

Look at all my stars!!
*******
Senior Member
4,030 posts

Joined: Apr 2008


EURO is bleeding to death... Sigh

mphpopular
post Oct 5 2008, 06:42 PM

bar chartist
*******
Senior Member
2,214 posts

Joined: Oct 2007
Basically GJ is juz like this for me.


Attached thumbnail(s)
Attached Image Attached Image
kevler
post Oct 5 2008, 06:43 PM

trading in the zone
*******
Senior Member
2,939 posts

Joined: Oct 2004
From: localhost


QUOTE(mphpopular @ Oct 5 2008, 04:07 PM)
We need another lower low (1.7435) by the end of coming this week to cr8 a bear trend again. If not, we might have the chance to go up back again...
By the way, I biased bear.
*
there is 2 pattern I saw in GU chart TF2H

1 - zig-zag , where GU will heading south , expecting below than 1.74xx

2. - flat , where GU will go bullish , expecting up to 1.81xx , but GU need to go south first to find its own "support" (expecting 1.72xx) before it able to bullish

agreed with mph , the trend still bearish ...enuff said


p/s belanja me if your trade "mengena" this time rclxms.gif

This post has been edited by kevler: Oct 5 2008, 06:45 PM
mphpopular
post Oct 5 2008, 06:45 PM

bar chartist
*******
Senior Member
2,214 posts

Joined: Oct 2007
QUOTE(kevler @ Oct 5 2008, 06:43 PM)
there is 2 pattern I saw in GU chart TF2H

1 - zig-zag , where GU will heading south , expecting below than 1.74xx

2. - flat , where GU will go bullish , expecting up to 1.81xx , but GU need to go south first to find its own "support" (expecting 1.72xx) before it able to bullish
p/s belanja me if your trade "mengena" this time rclxms.gif
*
LOL, I wish I didn't do any wrong on the analysis for GU. Basically I aiming for 1.6550. Sound quite unachievable for me...

mphpopular
post Oct 5 2008, 07:43 PM

bar chartist
*******
Senior Member
2,214 posts

Joined: Oct 2007
EJ, wont take any trade coz uncertainty for me.... hmm.gif


Attached thumbnail(s)
Attached Image Attached Image Attached Image
kelvin_tan
post Oct 5 2008, 08:20 PM

Passion for Pipping!
*******
Senior Member
3,141 posts

Joined: Nov 2006


a bit worried on EJ as well as i think it has dropped more then 1.5k pips already.. and its showing signs of reversal.. mayb time for EU and GU ^^

124 Pages « < 37 38 39 40 41 > » Top
Topic ClosedOptions
 

Change to:
| Lo-Fi Version
0.1151sec    0.69    6 queries    GZIP Disabled
Time is now: 6th December 2025 - 08:06 PM