hmm...i wonder if historical data will be of importance in forex...or until the year Euro comes out is good enough...
Forex Trading Corner V2
Forex Trading Corner V2
|
|
 May 4 2008, 12:16 AM May 4 2008, 12:16 AM
|
 
Senior Member
1,646 posts Joined: Jun 2007 |
hmm...i wonder if historical data will be of importance in forex...or until the year Euro comes out is good enough...
|
|
|
|
|
|
May 4 2008, 12:17 PM
|

Senior Member
4,081 posts Joined: Aug 2005 |
QUOTE(small-jeff @ May 4 2008, 12:16 AM) hmm...i wonder if historical data will be of importance in forex...or until the year Euro comes out is good enough... eh..., download chartnexus n analyse together lar stock..huhuhuh btw, need ur opinion in this ctr leh... i entered ramunia at 1.47 early this week...  entered bcoz its form ascendin triangle wit flat tops.. min TP 1.6X  dun really like weekly chart though.. show abit kaputin sign durin jun2007 |
|
|
May 4 2008, 02:57 PM
|
|
Senior Member
1,646 posts Joined: Jun 2007 |
from the weekly chart...taking low at Aug07 bout 0.75, and high at Feb08 bout 1.95...the Fibs would be 50%@1.35, 61.8%@1.49, 76.4%@1.67
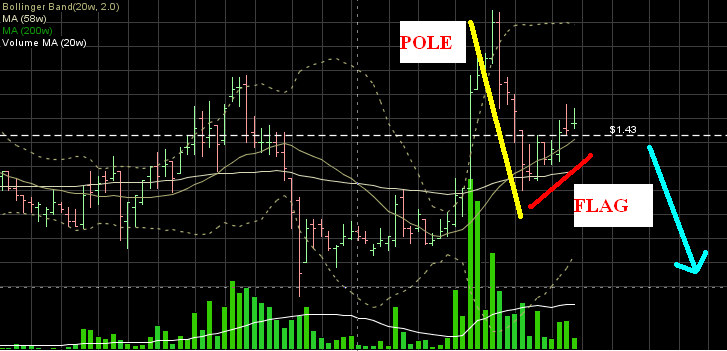
there was quite some congestion on Jul07. You see the upmove on early 08, it pass through the congestion zone with no prob. now the price is recovering, with the earlier upmove on early 08, it shouldnt have much prob passing this congestion area again. As for the recent congestion at Feb08, that is also around 1.67, is about the high during Jun07 and May06. So the critical retracement level is 76.4%. If the high on Feb08 is a new high, i will sell it on 1.60 le...may be crashing down once hitting 1.67...the price would bounce around the intermediate MA first, before going 1.60 see the price move on mid Jan08, after reaching 1.67, the upmove actually shows sign of weakness le...the further extension is mostly caused by momentum...can slightly confirm this by looking at oversold at RSI and the lower volume..if you can find is there's any previous high/low..then better..try draw Fib Fan on the low in Jul and high in Feb.. dunno la...i'm still an amature on tech analysis...lol Added on May 4, 2008, 6:29 pmoh no...lowyat...i just downloaded chartnexus...look at the attachment. Both Fibs are taken on same high/low. I believe it would be rather bearish soon..this is why: 1) Candlestick: shooting star followed by doji 2) Bearish Flag formation 3) Resistance at 61.8% fan line 4) Lowering on both RSI and Stochastic while prices moving up I dont think the price could reach 1.60 at all, unless there're any good news  This post has been edited by small-jeff: May 4 2008, 06:42 PM |
|
|
May 4 2008, 07:54 PM
|
|
Senior Member
4,081 posts Joined: Aug 2005 |
@small-jeff
Bearish Flag formation is wat?  thanks for d analysis... btw, for d candlestick part, my software analyse it 21-4-2008 as spinning tops, black -> reversal 51% of d time i dunno much candlesticks n nowadays vry less use indicator...  if u see this 1, it was above 1.43 for 3bar, for me its good sign.. moreover, d reduction of volume traded reduce alot,it shows, smart money is not dumpin alot of shares. they r actually clearin people who still stuck at above.. my cut loss woulb b if it close below 1.43 for 1-2bar or close below d triangle. |
|
|
May 4 2008, 08:13 PM
|

Senior Member
1,292 posts Joined: Dec 2004 |
QUOTE(low yat 82 @ May 4 2008, 07:54 PM) |
|
|
May 4 2008, 08:19 PM
|
|
Senior Member
4,081 posts Joined: Aug 2005 |
QUOTE(woopypooky @ May 4 2008, 08:13 PM) hi there, how did you put the volume indicator inside the price window? can put others like stochastics and rsi inside price window also mah? if u choose volume, it will automatically go to price window... n no,for charnexus other indicator cannot put in price window |
|
|
|
|
|
May 4 2008, 08:26 PM
|
|
Senior Member
1,292 posts Joined: Dec 2004 |
eh my bad.i thought it was MT4.
chartnexus looks good. does it comes free? does it have all the forex major pairs? This post has been edited by woopypooky: May 4 2008, 08:38 PM |
|
|
May 4 2008, 08:56 PM
|
|
Senior Member
4,081 posts Joined: Aug 2005 |
QUOTE(woopypooky @ May 4 2008, 08:26 PM) eh my bad.i thought it was MT4. MT4 got volume.. u can right click d price window n choose properties, then tick volume in price chart chartnexus looks good. does it comes free? does it have all the forex major pairs? no forex for chartnexus Added on May 4, 2008, 9:08 pm@ small jeff, it seems ur fan does work in klse... mind share wit me wat book it contains much ab this topic ka... or u jus brief me how to make it work... thanks.. This post has been edited by low yat 82: May 4 2008, 09:08 PM |
|
|
May 4 2008, 09:42 PM
|

Junior Member
612 posts Joined: Mar 2008 |
i'm using marketiva, my assistant is ForexKiller v2.0... i've made about USD$260 from equity USD5.00
|
|
|
May 4 2008, 10:00 PM
|
|
Senior Member
4,081 posts Joined: Aug 2005 |
QUOTE(Gaara92 @ May 4 2008, 09:42 PM) i'm using marketiva, my assistant is ForexKiller v2.0... i've made about USD$260 from equity USD5.00 good for u then  goodluck in comin years goodluck in comin years |
|
|
May 4 2008, 10:21 PM
|

Senior Member
3,833 posts Joined: Oct 2006 From: Shah Alam |
QUOTE(Gaara92 @ May 4 2008, 09:42 PM) i'm using marketiva, my assistant is ForexKiller v2.0... i've made about USD$260 from equity USD5.00 sound's too good to be true  |
|
|
May 4 2008, 10:23 PM
|

Junior Member
205 posts Joined: Apr 2007 From: Land Of The Head Hunter |
pips2 horayy~~~ gud luck u guyz ...
 |
|
|
May 4 2008, 10:33 PM
|
|
Senior Member
1,646 posts Joined: Jun 2007 |
QUOTE(low yat 82 @ May 4 2008, 07:54 PM) @small-jeff here...edited the pic to show bearish flag...Bearish Flag formation is wat? thanks for d analysis... btw, for d candlestick part, my software analyse it 21-4-2008 as spinning tops, black -> reversal 51% of d time i dunno much candlesticks n nowadays vry less use indicator... if u see this 1, it was above 1.43 for 3bar, for me its good sign.. moreover, d reduction of volume traded reduce alot,it shows, smart money is not dumpin alot of shares. they r actually clearin people who still stuck at above.. my cut loss woulb b if it close below 1.43 for 1-2bar or close below d triangle. » Click to show Spoiler - click again to hide... « hm..to me..smart people always knows where the direction of the chart is going de..they only make false BO to trap ppl so ppl will believe there's a reversal or something, after that, the chart will go back to its supposed to be direction...so, knowing the direction of the price, can sometimes ignore that there're smart money le.. IMO, usually flag is caused by market makers, giving false impression of reversal...but sometimes, a flag can become a reversal  haha..at least use RSI or Stochastic ba...you dont want long when it's overbought QUOTE(low yat 82 @ May 4 2008, 08:56 PM) MT4 got volume.. u can right click d price window n choose properties, then tick volume in price chart haha...Fibs and Gann works in every market prices. I read through "Fibonacci and Gann Applications in Financial Markets - George A. Maclean", and also the ebook you recommended no forex for chartnexus Added on May 4, 2008, 9:08 pm@ small jeff, it seems ur fan does work in klse... mind share wit me wat book it contains much ab this topic ka... or u jus brief me how to make it work... thanks.. but i still havent really been able to apply Gann's tools yet Fib fan is applied like Fib retracement. Usually i'll apply it in various time frames' high/low, both the vertical retracement and the fan together, then compare the retracement level of different time frame. From there, you'll see how easy/difficult is it for the price to make its directional movement. However, Fibs are only good when the market is rather volatile or moving relatively violent (IMO lar)..if the price is channelling; sideways, bearish of bullish, not so good to apply.. |
|
|
|
|
|
May 4 2008, 11:14 PM
|
|
Senior Member
4,081 posts Joined: Aug 2005 |
QUOTE(small-jeff @ May 4 2008, 10:33 PM) here...edited the pic to show bearish flag... ooo... will go through that book when i hav time... » Click to show Spoiler - click again to hide... « hm..to me..smart people always knows where the direction of the chart is going de..they only make false BO to trap ppl so ppl will believe there's a reversal or something, after that, the chart will go back to its supposed to be direction...so, knowing the direction of the price, can sometimes ignore that there're smart money le.. IMO, usually flag is caused by market makers, giving false impression of reversal...but sometimes, a flag can become a reversal haha..at least use RSI or Stochastic ba...you dont want long when it's overbought haha...Fibs and Gann works in every market prices. I read through "Fibonacci and Gann Applications in Financial Markets - George A. Maclean", and also the ebook you recommended but i still havent really been able to apply Gann's tools yet Fib fan is applied like Fib retracement. Usually i'll apply it in various time frames' high/low, both the vertical retracement and the fan together, then compare the retracement level of different time frame. From there, you'll see how easy/difficult is it for the price to make its directional movement. However, Fibs are only good when the market is rather volatile or moving relatively violent (IMO lar)..if the price is channelling; sideways, bearish of bullish, not so good to apply.. btw, i think it's cant b categories as flag as it is more than 1 month... this is suggested by bulkowski Characteristic QUOTE -Prices bounded by two Price action bounded by two parallel trend lines. Prices trend lines usually go against the prevailing trend: They rise in a downtrend and fall in an uptrend, but exceptions are common. -Three-week maximum Flags are short, from a few days to 3 weeks. Formations longer than 3 weeks are better classified as symmetrical triangles, rectangles, or wedges (rising or falling). -Steep, quick price trend These formations usually form near the midpoint of a steep, quick price trend. If you do not have a strong advance or decline leading to the chart pattern, ignore the flag. -Downward volume trend Volume usually trends downward throughout the formation. i think d correct name shud b measured move down -Corrective phase > Prices can move horizontally but usually rise and recover from 38% to 62% of the prior decline before resuming the downtrend. If the corrective phase nears or rises above the first leg high, look elsewhere. edited: hmm... mayb u right... i shud look at other indicator as well for strong confirmations... This post has been edited by low yat 82: May 4 2008, 11:17 PM |
|
|
May 4 2008, 11:19 PM
|
|
Junior Member
612 posts Joined: Mar 2008 |
QUOTE(kurtkob78 @ May 4 2008, 10:21 PM) sound's too good to be true yeah, that's incredible... i'm very happy... ahaks~ |
|
|
May 4 2008, 11:48 PM
|
|
Senior Member
1,646 posts Joined: Jun 2007 |
hm..tomorrow took leave...see how to trade during day time..hahaha
efit: lowyat..can understand what i explained ar? i read back...also feel confused myself..lol This post has been edited by small-jeff: May 4 2008, 11:52 PM |
|
|
May 5 2008, 12:21 AM
|
|
Senior Member
4,081 posts Joined: Aug 2005 |
QUOTE(small-jeff @ May 4 2008, 11:48 PM) hm..tomorrow took leave...see how to trade during day time..hahaha which part?efit: lowyat..can understand what i explained ar? i read back...also feel confused myself..lol can a.. jus take d keywords lor |
|
|
May 5 2008, 12:31 AM
|
|
Senior Member
1,646 posts Joined: Jun 2007 |
the fan part...
you also very strong ar...here trade forex...there trade stock... aih..tomorrow looks quite difficult for EU and UJ  anyway...if you're interested in the book, pm me your email ba... This post has been edited by small-jeff: May 5 2008, 12:33 AM |
|
|
May 5 2008, 10:53 AM
|
|
Senior Member
4,081 posts Joined: Aug 2005 |
QUOTE(small-jeff @ May 5 2008, 12:31 AM) the fan part... huhu... will slow down abit forex... coz i need sometime to forget ab few straight losses.. you also very strong ar...here trade forex...there trade stock... aih..tomorrow looks quite difficult for EU and UJ anyway...if you're interested in the book, pm me your email ba... mayb later ab d book.. coz wanna finish up EW books 1st ^.^ today ramunia must need to finish as up day.. if not, it is showin sign of weakness... Added on May 5, 2008, 11:00 amedited: d fan part r? yup... d concept same wit normal retracement... This post has been edited by low yat 82: May 5 2008, 11:00 AM |
|
|
May 5 2008, 05:32 PM
|
|
Senior Member
1,646 posts Joined: Jun 2007 |
go for brokers that have ready made indicator packages, then let it automatically trade for you, and you'll be millionaire soon...
 forex very easy to earn money forex very easy to earn money  Added on May 5, 2008, 5:48 pmlowyat...why the chartnexus still at 2/5/08 ar? wont update one? or have to wait till the market closes first? This post has been edited by small-jeff: May 5 2008, 05:48 PM |
|
Topic ClosedOptions
|
| Change to: |  0.0260sec 0.0260sec
 0.24 0.24
 6 queries 6 queries
 GZIP Disabled GZIP Disabled
Time is now: 6th December 2025 - 06:08 PM |
 Quote
Quote