QUOTE(low yat 82 @ Jun 24 2008, 12:31 PM)
tirin scalpin...

You done a great job. You make it man...
QUOTE(eRiCCa @ Jun 24 2008, 01:53 PM)
hey this sounds so interesting!! can i join the fun? =P i need a GURU!!
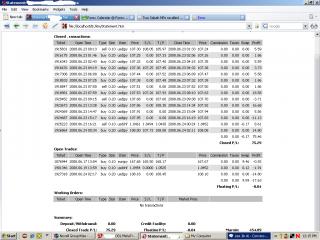
anyway lowyat, i have been reading all these screen shots... but i dont understand how to read, beside greens/reds, buy/sell... what is the buying price and selling price? price/price? what is SL and TP? the profit is USD or some other units? like what is PIPs that i have seen somewhere... AND... i am confused with the SIZE...
for example, if you can explain the NUMBERS from the last row of your screen shot...
TIA~
Green or reds doesn't matter, Cause some trader prefer red as bulll or green as bear as well. We did not post any buying price or selling price here, since we are not qualified as signal provider yet. Haha

Profit is mostly on USD. Juz either in cents or in dollars.
Size is different when you using different account. It is more easy if you see on pips value. Mean 1pips movement = USD how much?
For Alpari, trade 0.01 unit , 1 pips movement = USD 0.10
For IBFX mini, trade 0.01 unit, 1pips movement = USD 0.01
The value will differ by account types.
QUOTE(normeck @ Jun 24 2008, 02:32 PM)
www.babypips.com
www.forexfactory.com
www.forex-tsd.com
Juz guide him abit..He might juz a newbie like me in once upon a time.... Haha.
@ericca
read thru this forum. You can get alot knowledge one lor.
QUOTE(kevler @ Jun 24 2008, 03:44 PM)
My GJ weekly
based on my stochastic setup , GJ week go for major bearish , waiting for the stoch intersection .
Once the price break thru 211.29. Then i might take for the bear run. I got your point on your chart. But i will juz wait juz like you.
This post has been edited by mphpopular: Jun 24 2008, 05:24 PM 

 Jun 23 2008, 07:52 PM


 Quote
Quote


 Looking around.... Find the currencies... Haha.... I currently shorting GU. But will depen on situation to see whether i should exit it. SL set at enter price +1. At least i willl have 1 pips gains if direction go terbalik wif me.

 huhu.. im still running tc EA, v34.1 but at lite-forex.
 0.0262sec
 0.35
0.35
 6 queries
 GZIP Disabled