Welcome Guest ( Log In | Register )

Bump Topic Topic Closed RSS Feed
125 Pages « < 108 109 110 111 112 > » Bottom

Outline · [ Standard ] · Linear+

 Forex Trading Corner V2

views
     
mphpopular
post Jun 25 2008, 09:23 PM

bar chartist
*******
Senior Member
2,214 posts

Joined: Oct 2007
U mean your EJ hold a position very long alredy is it???
I thinking to setup an acount over fxmalay, to train up my long term trading skill. Only use the account to trade daily TF and monthly TF. Stop Loss sure very big one. So thinking to give it a try wif micro pips..... Haha...

I love daily analysis more than shorter TF. Daily and MOnthly, only need to hunt around all pairs for breakout, retrace, empty space to fill in for a channel, follow a channel. I trade longer TF based on all these. Seldom use any indicators. Moz important thing is draw draw draw. I willl take up my efford to learn the EW from all the guru here before i start my long term trading...

EW sure very useful in Longer TF. Muz learn it faz faz.
low yat 82
post Jun 25 2008, 09:39 PM

time is nearing to end
*******
Senior Member
4,081 posts

Joined: Aug 2005


QUOTE(mphpopular @ Jun 25 2008, 09:23 PM)
U mean your EJ hold a position very long alredy is it???
I thinking to setup an acount over fxmalay, to train up my long term trading skill. Only use the account to trade daily TF and monthly TF. Stop Loss sure very big one. So thinking to give it a try wif micro pips..... Haha...

I love daily analysis more than shorter TF. Daily and MOnthly, only need to hunt around all pairs for breakout, retrace, empty space to fill in for a channel, follow a channel. I trade longer TF based on all these. Seldom use any indicators. Moz important thing is draw draw draw. I willl take up my efford to learn the EW from all the guru here before i start my long term trading...

EW sure very useful in Longer TF. Muz learn it faz faz.
*
here i think onli left 1 dat is good in EW... dat is kevler.. d rest still learnin sweat.gif sweat.gif include me..lol.. now m tryin to learn awesome oscilator which is use to help u in wave countin...

got 1 week lor i think forgot i open d EJ... swap got 9.46usd... uhuhu

btw, for me its d same... a good system or tactics shud work in any time frame.. same as EW also..

d aim to trade shorter time frame so dat u can gain experience faster wit d risk of more losses..


this is some of d scalpin dat i do... u see... d losses sometimes can take up to 10 profit trades!! dats y must need abit of luck to do scalpin..
Attached Image

This post has been edited by low yat 82: Jun 25 2008, 09:51 PM
small-jeff
post Jun 25 2008, 09:58 PM

Regular
******
Senior Member
1,646 posts

Joined: Jun 2007
@mph:
wah...trading on monthly/daily charts need big free margin.. shocking.gif

@lowyat:
yalor...scalping need to be 99% precise. 1 lost = 10-20 profit gone for me...lol..

anyway, i was looking at EJ too...one of my fav pairs.. biggrin.gif
was hoping it'll head higher...


Attached thumbnail(s)
Attached Image
low yat 82
post Jun 25 2008, 10:18 PM

time is nearing to end
*******
Senior Member
4,081 posts

Joined: Aug 2005


QUOTE(small-jeff @ Jun 25 2008, 09:58 PM)
@mph:
wah...trading on monthly/daily charts need big free margin.. shocking.gif

@lowyat:
yalor...scalping need to be 99% precise. 1 lost = 10-20 profit gone for me...lol..

anyway, i was looking at EJ too...one of my fav pairs.. biggrin.gif
was hoping it'll head higher...
*
huhuh... monthly n daily is vry emotional tradin if u do not noe much ab EW... u hav to withstand emotion n sometimes big swing...


wa.... small jeff, can hav a look at GJ? d OBV has broken from downtrend drool.gif will do more analysis shortly...
small-jeff
post Jun 25 2008, 10:37 PM

Regular
******
Senior Member
1,646 posts

Joined: Jun 2007
QUOTE(low yat 82 @ Jun 25 2008, 10:18 PM)
huhuh... monthly n daily is vry emotional tradin if u do not noe much ab EW...  u hav to withstand emotion n  sometimes big swing...
wa.... small jeff, can hav a look at GJ?  d OBV has broken from downtrend  drool.gif  will do more analysis shortly...
*
sure biggrin.gif drew this few days ago, hope it's still applicable.. tongue.gif

for the time being, if we look at the 4H chart, it's bouncing off the 7/8th line. Both Stochastic and RSI are showing turning point, but that's not a main part. Main part is the weakening of the up move. Notice the struggle to break into higher high. The current reversal might drop down to the 5/8th level, or lower due to the weaker support zone. Then it might try to attack the 7/8th level again, if there's still steam left in the bull.

Looking at the Daily chart, to best is the price will head up towards +- 213.90 .. wave 4 should end there.


Added on June 25, 2008, 10:49 pm@mph:

i tried trading with the GCI you intro bout...not bad hor...had 2 positions on it... tongue.gif

This post has been edited by small-jeff: Jun 25 2008, 10:52 PM


Attached thumbnail(s)
Attached Image Attached Image Attached Image
low yat 82
post Jun 25 2008, 10:51 PM

time is nearing to end
*******
Senior Member
4,081 posts

Joined: Aug 2005


d 7/8th line bla bla bla is from gann?

for meantime i think still in uptrend... OBV or A/D is good for entry but slow to spot TP,,.. lol


thinkin to use MACD to spot TP.. hmm 214....

Attached Image

edited: thanks btw small jeff thumbup.gif

This post has been edited by low yat 82: Jun 25 2008, 10:55 PM
low yat 82
post Jun 25 2008, 10:51 PM

time is nearing to end
*******
Senior Member
4,081 posts

Joined: Aug 2005


damn maxis wireless broadband!!

This post has been edited by low yat 82: Jun 25 2008, 10:52 PM
small-jeff
post Jun 25 2008, 10:57 PM

Regular
******
Senior Member
1,646 posts

Joined: Jun 2007
haha...yeah, it's the Gann thing, but slightly modified tongue.gif

If wanna target for 214, better wait till it makes to a new high first..

But if my counting is correct, it's already near to end of wave 4. Need to ask kevlar to confirm le.. biggrin.gif

edit:
anyone trading on commodities too? oil seems to be going down biggrin.gif good for all!! hahaha

This post has been edited by small-jeff: Jun 25 2008, 10:58 PM
low yat 82
post Jun 25 2008, 11:15 PM

time is nearing to end
*******
Senior Member
4,081 posts

Joined: Aug 2005


QUOTE(small-jeff @ Jun 25 2008, 10:57 PM)
haha...yeah, it's the Gann thing, but slightly modified tongue.gif

If wanna target for 214, better wait till it makes to a new high first..

But if my counting is correct, it's already near to end of wave 4. Need to ask kevlar to confirm le.. biggrin.gif

edit:
anyone trading on commodities too? oil seems to be going down biggrin.gif good for all!! hahaha
*
ic... m lookin for smaller swing.. haiz.. still try to find a good TP..


dun wan touch commodities yet tongue.gif
small-jeff
post Jun 25 2008, 11:19 PM

Regular
******
Senior Member
1,646 posts

Joined: Jun 2007
swing small ar..then scalp biggrin.gif ...actually if scalping, you can try the method i'm using...the slightly modified Gann retracement...it works very nicely... biggrin.gif

This post has been edited by small-jeff: Jun 25 2008, 11:20 PM
low yat 82
post Jun 25 2008, 11:29 PM

time is nearing to end
*******
Senior Member
4,081 posts

Joined: Aug 2005


QUOTE(small-jeff @ Jun 25 2008, 11:19 PM)
swing small ar..then scalp biggrin.gif ...actually if scalping, you can try the method i'm using...the slightly modified Gann retracement...it works very nicely... biggrin.gif
*
hmm... dunno much ab dat though... think i'll stick to MACD/ trendline.. thanks anyway.. notworthy.gif
mphpopular
post Jun 25 2008, 11:29 PM

bar chartist
*******
Senior Member
2,214 posts

Joined: Oct 2007
As i said, i currently trying to deal wif 3 trading method,

1) Is long term, all based on Daily TF, Weekly and Monthly TF.
Moz of the trade taken using the opportunity of trendline break, channel break, resistance and support, following channel or trend, empty space over a channel. Didn't use much indicators to trade for this. Is kind of hunting opportunity.

2) Short term, for cari makan
This method currently still in development. I trying to suit it into GU 15m only currently. Using a most simplify method, mean did not wait for much indicators to approve your entry. Juz simple use 2 indicators only. The aim is to take 20 to 30 pips or even 5 pips per trade, and is to sapu all trade oppportunities that available over GU. Currently a few of my live trade was done using this method. Quite efficient so far.

3) My old trading method
This method really susah cari makan. Cause i nid wait DMI CCI MOM all to agree in order to take entry. So i wil put that as my backup as soon as my 2nd method is done and ready to cari makan....

Method 2 is a development under me and my friend. Take alot of time do it. So, i asked him is it ok for me to post out. He agreed, so i will post it out.
So special thanks to you, my fren.
The main idea is the black line over the graph. That is the main engine of this trade methodologies.

NOTE: STILL UNDER DEVELOPMENT. MORE TEST AND MARKET ENVIRONMENT NEEDED TO TEST THIS TRADING METHODOLOGIES

This post has been edited by mphpopular: Jun 25 2008, 11:31 PM


Attached thumbnail(s)
Attached Image
low yat 82
post Jun 25 2008, 11:35 PM

time is nearing to end
*******
Senior Member
4,081 posts

Joined: Aug 2005


QUOTE(small-jeff @ Jun 25 2008, 11:19 PM)
swing small ar..then scalp biggrin.gif ...actually if scalping, you can try the method i'm using...the slightly modified Gann retracement...it works very nicely... biggrin.gif
*
hmm... dunno much ab dat though... think i'll stick to MACD/ trendline.. thanks anyway.. notworthy.gif
low yat 82
post Jun 25 2008, 11:54 PM

time is nearing to end
*******
Senior Member
4,081 posts

Joined: Aug 2005


@small jeff,

still rememb wat i said sometimes ago ab d things dat i learn after my big losses but in d end i gain valueable knowledge?


well, see d pic at below.. d square 1.. zig zag wit '5' settin.. when d 2nd tops did not hav zig zag touch it, usually from my observations, they hav huge drop down n cover it up in d end may all forummer can join me to shorten d time to confirm this ... i;ve seen this quite a no. of times in 1hr chart..

Attached Image
mphpopular
post Jun 26 2008, 12:04 AM

bar chartist
*******
Senior Member
2,214 posts

Joined: Oct 2007
To those who interested :

Here is the link to get all the indicators. I also post out the template for you to attach on graph and run.
The file name is mphpopular&uf --> uf and me together come wif this.
Actually UF does more work on this trading Metho. I mozly work wif the setting.

http://www.4shared.com/account/dir/7519399...ring.html?rnd=3

Plz give me some time to explain... Don't rush me.


Here it started:
The arrow (QQEA) currently not working well yet. As we said, still under development. Cause the arrow currently still come out too late. Alway late one candle. Still trying to adapt wif the setting to go thru.

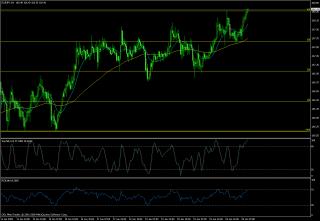
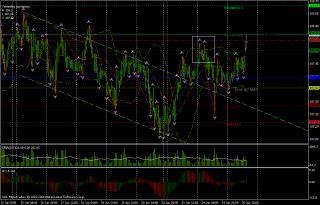
The blue line in the graph is the main engine. This is the point where we start our small project on this trading methodologies. We get it at a public download server. And we found out it is quite applicable over some TF. That's why we started on it.

PsAR is to show the trend, so that you didn't crash wif trend.

Stoch is to indicate you there is a reversal / or a signal nearby. Plz watch out and stay wif your chart abit.... Haha.

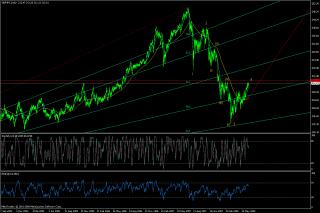
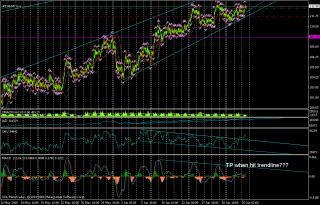
I don't really take into consideration of the pivot, support and resistance point in this metho, cause it will limit my trades. This metho is used to gain small pips, even 5 is enough. Currently still didn't have any way to put TP yet. Muz consider yourself. Haha


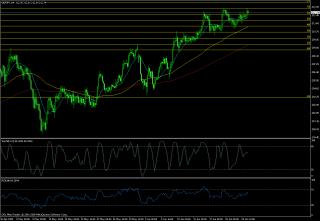
Note: We only tested it on GU 15m and GU 30m. Other pair not yet been tested so far.

I'm waiting for more recommendation on Stoch, SSL, Psar, and QQEA setting. Anyone who have tested it can comment on anything you want. Include bad and goods.

I admit this method helping me win pips for this weeks in GU15m.. include the trade i in right now... But i still waiitng the time it make me lose money.. the time it make me lose money, then only i know where the problem.

Note: Plz go on demo first to make sure you understand what is this metho is doing.
Note: This project still under development, we open this up is wish to get more feedback in order to improve this metho. So do not go real for this. And we did not bear any risk for this metho.

Edit:
More explanation

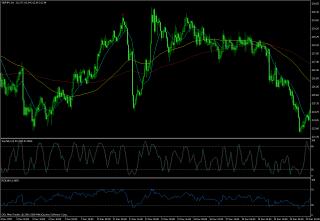
The stoch muz cross (remember is cross) below 20 area or above 80 area. In betwwen 20 and 80 is called risky mode, juz escape the trade and take a nap.

PSar must say yes

No take late signal. Once the candle is closed (fully under the blue line), open the trade in next new candles ASAP. If you're late, wait again. There is always chance for you.

SL is a must. Set it above or below the blue line.

The arrow juz ignore it first, still under development, it is not valid as your entry signal.

This post has been edited by mphpopular: Jun 26 2008, 12:11 AM
small-jeff
post Jun 26 2008, 12:05 AM

Regular
******
Senior Member
1,646 posts

Joined: Jun 2007
i think i know what you're saying. However, i look from candlesticks. The below pic is one of the examples, pointed by the red arrow.

Usually this is how it happens, in either 1H or 4H.
In an up move, the higher shadow is at X.XX ...then the next bar closes lower, a down bar, but with a similar or same higher shadow at X.XX too. When this occurs, it's rather much an extream reversal sign for me. Seen this quite often... However, in the pic i attached, it's a bearish engulfing. Sometimes, the down bar might just close within the body of the previous up bar (lazy to find le tongue.gif), but with the same or almost similar high, shown to be extreamly reversal as well..

added:

It has to be the top/bottom of the moving trend...meaning, if its a up trend, the same high for both of the candlesticks must be at top. Similarly for down trend, the low for both bars must be at bottom.

added another 2 examples.

For the pic with 2 arrows, the arrow on the left can actually be treated reversal due to the shooting star formation. The second arrow on the right, that's much more what i'm trying to say...dunno whether there's a term to this...lol..

forgot to add, it shouldnt be inside a consolidation zone...and the difference between both high/low should be within 2-3 pips

This post has been edited by small-jeff: Jun 26 2008, 12:19 AM


Attached thumbnail(s)
Attached Image Attached Image Attached Image
low yat 82
post Jun 26 2008, 12:13 AM

time is nearing to end
*******
Senior Member
4,081 posts

Joined: Aug 2005


QUOTE(mphpopular @ Jun 25 2008, 11:29 PM)
As i said, i currently trying to deal wif 3 trading method,

1) Is long term, all based on Daily TF, Weekly and Monthly TF.
Moz of the trade taken using the opportunity of trendline break, channel break, resistance and support, following channel or trend, empty space over a channel. Didn't use much indicators to trade for this. Is kind of hunting opportunity.

2) Short term, for cari makan
This method currently still in development. I trying to suit it into GU 15m only currently. Using a most simplify method, mean did not wait for much indicators to approve your entry. Juz simple use 2 indicators only. The aim is to take 20 to 30 pips or even 5 pips per trade, and is to sapu all trade oppportunities that available over GU. Currently a few of my live trade was done using this method. Quite efficient so far.

3) My old trading method
This method really susah cari makan. Cause i nid wait DMI CCI MOM all to agree in order to take entry. So i wil put that as my backup as soon as my 2nd method is done and ready to cari makan....

Method 2 is a development under me and my friend. Take alot of time do it. So, i asked him is it ok for me to post out. He agreed, so i will post it out.
So special thanks to you, my fren.
The main idea is the black line over the graph. That is the main engine of this trade methodologies.

NOTE: STILL UNDER DEVELOPMENT. MORE TEST AND MARKET ENVIRONMENT NEEDED TO TEST THIS TRADING METHODOLOGIES
*
if not mistaken, i heard u said b4 u noe ab programmin, then y not develop EA n backtest it? n u can noe ur system is worth to continue pursue or not..

it needs lots of hardwork n time to develop a good tradin system.. goodluck to u..
low yat 82
post Jun 26 2008, 12:23 AM

time is nearing to end
*******
Senior Member
4,081 posts

Joined: Aug 2005


QUOTE(small-jeff @ Jun 26 2008, 12:05 AM)
i think i know what you're saying. However, i look from candlesticks. The below pic is one of the examples, pointed by the red arrow.

Usually this is how it happens, in either 1H or 4H.
In an up move, the higher shadow is at X.XX ...then the next bar closes lower, a down bar, but with a similar or same higher shadow at X.XX too. When this occurs, it's rather much an extream reversal sign for me. Seen this quite often... However, in the pic i attached, it's a bearish engulfing. Sometimes, the down bar might just close within the body of the previous up bar (lazy to find le tongue.gif), but with the same or almost similar high, shown to be extreamly reversal as well..

added:

It has to be the top/bottom of the moving trend...meaning, if its a up trend, the same high for both of the candlesticks must be at top. Similarly for down trend, the low for both bars must be at bottom.

added another 2 examples.

For the pic with 2 arrows, the arrow on the left can actually be treated reversal due to the shooting star formation. The second arrow on the right, that's much more what i'm trying to say...dunno whether there's a term to this...lol..

forgot to add, it shouldnt be inside a consolidation zone...and the difference between both high/low should be within 2-3 pips
*
wat im tryin to say is, 1-2days after dat... d whole of d tops (in square) been covered.. it happens not in d same day..

Attached Image

edited:

m still need data to confirm this..

i've been tradin in this type, wat i can say is, d emotion is greatly invovle as u go against d trend... d main point is to buy(for d case dat i post d pic), but how low it will go?can withstand d scare of goin lower? d feelins to hold overnight is vry scary especially ur pips r negetive.. sweat.gif

This post has been edited by low yat 82: Jun 26 2008, 12:31 AM
small-jeff
post Jun 26 2008, 12:30 AM

Regular
******
Senior Member
1,646 posts

Joined: Jun 2007
QUOTE(low yat 82 @ Jun 26 2008, 12:23 AM)
wat im tryin to say is, 1-2days after dat...  d whole of d tops (in square) been covered.. it happens not in d same day..

Attached Image
*
oops...messed up again..sorry tongue.gif

hmm...like that er...didnt really notice it..


Added on June 26, 2008, 12:32 ambut that often happen for head and shoulders, especially when it's forming the neckline of a shoulder...


Added on June 26, 2008, 12:42 amhmm...lowyat, maybe you can identify the nearest strong resistant and support as your S/L. Add a few more pips away from the identified S or R as your SL. then can sleep better biggrin.gif ya...trading against the trend is very scary.. sad.gif

for larger S/L, can use Fib retracement. Smaller, can use Fib Fanline. For more detailed placing S/L, use Gann's method.. tongue.gif

This post has been edited by small-jeff: Jun 26 2008, 12:42 AM
mphpopular
post Jun 26 2008, 12:50 AM

bar chartist
*******
Senior Member
2,214 posts

Joined: Oct 2007
QUOTE(small-jeff @ Jun 25 2008, 10:37 PM)
@mph:

i tried trading with the GCI you intro bout...not bad hor...had 2 positions on it... tongue.gif
*
Now only i got time to rest a while and have been reading thru your gann.

QUOTE(small-jeff @ Jun 25 2008, 10:57 PM)
haha...yeah, it's the Gann thing, but slightly modified tongue.gif

If wanna target for 214, better wait till it makes to a new high first..

But if my counting is correct, it's already near to end of wave 4. Need to ask kevlar to confirm le.. biggrin.gif

edit:
anyone trading on commodities too? oil seems to be going down biggrin.gif good for all!! hahaha
*
Wish kevler come and say something soon.... Comodities currently no time for it.. Cause even forex also no time liao..Haha. And comodities nid more capital right?


QUOTE(low yat 82 @ Jun 25 2008, 11:54 PM)
@small jeff,

still rememb wat i said sometimes ago ab d things dat i learn after my big losses but in d end i gain valueable knowledge?
well, see d pic at below.. d square 1.. zig zag wit '5' settin.. when d 2nd tops did not hav zig zag touch it, usually from my observations, they hav huge drop down n cover it up in d end  may all forummer can join me to shorten d time to confirm this ... i;ve seen this quite a no. of times in 1hr chart..

*
I faced this before, But i would recommend a wait. Wait at least it shows more bear power. Cause very pressure go against market. You dunno want to exit or not. Cause we not sure when the fall will begin. I worry is it we will enter the market too soon to go for bear.

QUOTE(low yat 82 @ Jun 26 2008, 12:13 AM)
if not mistaken, i heard u said b4 u noe ab programmin, then y not develop EA n backtest it? n u can noe ur system is worth to continue pursue or not..

it needs lots of hardwork n time to develop a good tradin system..  goodluck to u..
*
My knowledge is limited and not enough for programming. Might be will find some frenz over FF to give me a hand or depends how. I still trying to develop it for GU. I made it only for GU. Trying to get the best setting for GU 15m TF. My fren and I have been using a lot of time in testing and getting up setting. The template that i post is OPTIMUM FOR GU 15M, NOT FOR ALL.( All that tried the template plz note on this.) ONLY GU 15M.


This post has been edited by mphpopular: Jun 26 2008, 12:53 AM

125 Pages « < 108 109 110 111 112 > » Top
Topic ClosedOptions
 

Change to:
| Lo-Fi Version
0.0205sec    0.66    6 queries    GZIP Disabled
Time is now: 9th December 2025 - 09:54 AM