

Which M'sian online share trading platform allows trailing stop order?
OSK188 does not.

Thanks.
Q&A, General question on stock market
|
|
 Mar 7 2013, 07:43 PM Mar 7 2013, 07:43 PM
Return to original view | Post
#21
|
 
Senior Member
4,761 posts Joined: Jun 2007 From: My house |
Need help from experts here.
Which M'sian online share trading platform allows trailing stop order? OSK188 does not. Thanks. |
|
|
|
|
|
Mar 7 2013, 07:56 PM
Return to original view | Post
#22
|
|
Senior Member
4,761 posts Joined: Jun 2007 From: My house |
QUOTE(gark @ Mar 7 2013, 07:49 PM) As far as I know, non of the online platform feature trailing stop order. I see the new CIMB platform has this function, but I have not tested it whether it works. I am scared if they accidentally sell off all my stocks. gark, Most platform has SMS info if price cross certain threshold, so you can buy sell your self.  Thanks. I think OSK188 also have this trailing stop function (looking at their LIMIT and DAY functions) but these two functions are inactive. Noted on your SMS route. Looks like we are behind on this front compared to the US. Cheerio. |
|
|
Mar 22 2013, 10:43 AM
Return to original view | Post
#23
|
|
Senior Member
4,761 posts Joined: Jun 2007 From: My house |

Hope some sifu can help me with this. E.g. BAT NTA is 1.7 while its price is 60.2 If I buy BAT at 60.2, I am also buying a company with assets worth only 1.7/share, right? Yes, understand that the total worth of a company can include intangible assets (patents, goodwill etc). Even then it is scary to pay 60 while knowing its real asset is only 1.7 Please clarify if I understood it wrongly or other important points on NTA and intrinsic value. Many thanks.  |
|
|
Mar 22 2013, 01:25 PM
Return to original view | Post
#24
|
|
Senior Member
4,761 posts Joined: Jun 2007 From: My house |
QUOTE(gark @ Mar 22 2013, 12:09 PM) 1. Yes asset only worth 1.7/share gark,2. NTA = Net tangible Asset, so all intangible asset like goodwill, patents etc all removed from calculation. 3. NTA is only important if there is a liquidation in which the company asset will be used to pay bond holder, creditors and finally shareholders. Companies like BAT does not have huge asset base as their business (cigarette making) does not need high investment in plant & machinery. It is the marketing and sales which is important for this company. 4. NTA should be looked at, but not necessary for the calculation of intrinsic value. 5. It is only when a company is liquidized, NTA comes into play. Hence NTA is important only as a margin of safety. 6. In the case of BAT, NTA should not matter much unless there is some drastic changes to the business. Noted and thanks. It is still scary to put in 60 knowing that one will only get back 1.7 when it is in trouble. I guess that is the norm in stock market. For my peace of mind, will do this P/NTA for the 30 giants in KLCI to confirm the norm. Cheerio. |
|
|
Mar 22 2013, 04:26 PM
Return to original view | Post
#25
|
|
Senior Member
4,761 posts Joined: Jun 2007 From: My house |

Did the P/NTA chart for KLCI companies as above. Could not get the data for some companies. Thought BAT was scary with the high P/NTA. Digi is even more scary. Ha. Looking this from another angle, P is high is due to many factors. One of which is assets behind it. Also earning power and this is not reflected in NTA. So thus some comfort for some companies with high P/NTA. My 3 cents. |
|
|
Mar 23 2013, 10:19 AM
Return to original view | Post
#26
|
|
Senior Member
4,761 posts Joined: Jun 2007 From: My house |

Surprised to see the very good relationship between ROE and P/NTA (r2 >0.95). Used data from about 190 companies (those which have been profiting for the past 3 years). Takeaway for me is, if the P/NTA is high, ensure its ROE is also high. Otherwise, check the next company.  My 3 cents. |
|
|
|
|
|
Mar 23 2013, 10:56 AM
Return to original view | Post
#27
|
|
Senior Member
4,761 posts Joined: Jun 2007 From: My house |
QUOTE(gark @ Mar 23 2013, 10:40 AM) If you look at the calculations you will see the link between NTA and ROE. So it is basically plotting the same thing on the x and y axis. Ha. No wonder the r2 is so high.NTA = Tangible Asset - Liabilities Equity = Total Asset - Total Liabilities ROE = Earnings / Equity PE = Price / Earnings PNTA = Price/NTA If you calculate out the above, you will see that ROE is very much related to NTA (except for intangibles), and it is no surprise that P/NTA is high so will the ROE. Thanks for the insight. |
|
|
Mar 23 2013, 10:59 AM
Return to original view | Post
#28
|
|
Senior Member
4,761 posts Joined: Jun 2007 From: My house |
QUOTE(gark @ Mar 23 2013, 10:55 AM) If you want to find gems in the bush, perhaps you want to like compare PE to ROE which is a more accurate measure of company performance. But since ROE changes every year, try to take and average of 5 years, or the longer the better. OK, will give this a try.If a company is selling at low PE / average ROE, it means that they company is generating a lot of profits at very low valuation.. Remember Rate of growth (Assuming ROE is constant) = ROE% - ( 1- (DPS-EPS)), so high dividend company does not necessary have high rate of growth if they pay out all their dividends. In Joel Greenblatt's book, he has used this PE vs ROE formula for the past 15 years and it beat the market every single year. But his calculation is a bit more complicated as his ROE exclude taxes, amortization, interest (more or less nearly similar to FCF cash flow/equity) These does not work with utilities and financial companies. If you are free to generate a list we can discuss further..  Cheerio. |
|
|
Mar 23 2013, 11:18 AM
Return to original view | Post
#29
|
|
Senior Member
4,761 posts Joined: Jun 2007 From: My house |
QUOTE(cherroy @ Mar 23 2013, 11:04 AM) Market give valuation (stock price) primary based on the company ability to generate profit / dividend to the shareholders. Noted and thanks!NTA/NAV is secondary issue, as it only matter when company liquidate time. That's why we see BAT is trading at way higher than its NTA because it can generate handsome profit/dividend to shareholders. While we see some stocks are trading at below NTA, due to profit generated is not as good or some making loss. This ratio is not that meaningful as difference industry has different situation. For eg. Steel company need massive capex to produce a sale generally so it may have higher NTA than a servicing company that do not require much capex to generate the same sale level. Cheerio |
|
|
Mar 25 2013, 10:39 AM
Return to original view | Post
#30
|
|
Senior Member
4,761 posts Joined: Jun 2007 From: My house |
Looking at ROC (return on capital) and one thing pops up.
I thought capital = equity + liabilities (i.e., all the money put into the company). But found this after Googling: The following is the Equity equation: Total Assets minus Total Liabilities (T - A = E). T - A (or Equity) is also referred to as Net Worth, Capital & Shareholders Equity. T-A = E = capital Then ROE = ROC? Thanks. |
|
|
Mar 25 2013, 09:26 PM
Return to original view | Post
#31
|
|
Senior Member
4,761 posts Joined: Jun 2007 From: My house |
QUOTE(river.sand @ Mar 25 2013, 08:58 PM) I check my MBA notes, and found these: Many thanks!Return on Invested Capital (ROIC) = (net income + interest(1 - tax rate))/invested capital whereby: Invested capital = permanent capital = long term liabilities + shareholders' equity Note that net income is the American equivalent of profit after tax, and long term liabilities are non-current liabilities. Investopedia gives another definition for ROIC: ROIC = (net income - dividends)/total capital Well, I have no idea how significant ROIC is  I must borrow and scan your MBA notes! Ha. So my C = E + L is close but not 100% correct. Why am I looking at ROC? gark mentioned Joel Greenblatt's method which I did some reading, he uses earning yield and ROC in his magic formula. In the mist of finding out more,,,, Cheerio. This post has been edited by plumberly: Mar 26 2013, 08:18 AM |
|
|
Mar 27 2013, 01:23 PM
Return to original view | Post
#32
|
|
Senior Member
4,761 posts Joined: Jun 2007 From: My house |
QUOTE(gark @ Mar 23 2013, 10:55 AM) If you want to find gems in the bush, perhaps you want to like compare PE to ROE which is a more accurate measure of company performance. But since ROE changes every year, try to take and average of 5 years, or the longer the better. If a company is selling at low PE / average ROE, it means that they company is generating a lot of profits at very low valuation.. Remember Rate of growth (Assuming ROE is constant) = ROE% - ( 1- (DPS-EPS)), so high dividend company does not necessary have high rate of growth if they pay out all their dividends. In Joel Greenblatt's book, he has used this PE vs ROE formula for the past 15 years and it beat the market every single year. But his calculation is a bit more complicated as his ROE exclude taxes, amortization, interest (more or less nearly similar to FCF cash flow/equity) These does not work with utilities 9too much capex hence low FCF) and financial companies (too much debt, hence equity skewed). If you are free to generate a list we can discuss further.. 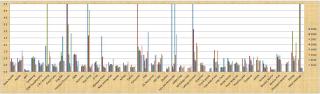
PE/ROE graph as above. Some companies with low PR/ROE (e.g. BAT, Sportstoto) and also fairly consistent through the last few years. Maybe also worthwhile to look at reducing PE/ROE (indicating they are doing better)? Next check? Cheerio |
|
|
Apr 1 2013, 09:56 AM
Return to original view | Post
#33
|
|
Senior Member
4,761 posts Joined: Jun 2007 From: My house |

Don't understand why are the different quantities categorised as either BUY or SELL. When there is a sell, there is a buy. And vice versa. How are they categorised as BUY or SELL? Many thanks. |
|
|
|
|
|
Apr 3 2013, 07:02 PM
Return to original view | Post
#34
|
|
Senior Member
4,761 posts Joined: Jun 2007 From: My house |
QUOTE(dEviLs @ Apr 2 2013, 11:56 AM) It means whether that trade is entered by someone to match the bid quote or ask quote. Thanks.For example, a BUY means a guy matching the existing ask quote in queue. and vice versa Am I right in saying, if A puts in 1000 shares at RM10 for sale and later B puts in 1000 shares to buy at RM10, then it is a SELL? A BUY if C puts in to buy at X & Y and later D puts in to sell at X & Y, then it is a BUY? Many thanks. |
|
|
Apr 8 2013, 10:19 PM
Return to original view | Post
#35
|
|
Senior Member
4,761 posts Joined: Jun 2007 From: My house |
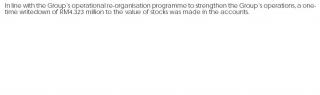
Need help from sifus again. Am I right in reading the above writedown to mean that the company decided to report a lower stock value (4.3 million less)? Why? How would that help the company? Many thanks. |
|
|
Apr 10 2013, 09:17 AM
Return to original view | Post
#36
|
|
Senior Member
4,761 posts Joined: Jun 2007 From: My house |
QUOTE(gark @ Apr 9 2013, 04:45 PM) Write down of stocks is common, however if the amount is big then it is a red flag. Thanks again gark!When you write down the stock, you need to register the amountas 'loss' in the PBT. Stock write down is required as part of auditing, usually required by auditors. Write down of stock could be due to the following :- 1. Stock is no longer worth at same value - ie now worth lower value so write down the difference 2. Damaged stock, lost stock, expired stock, obsolete stocks - no longer sale able, hence write down the entire value 3. Product not sale able at holding price, hence need discount to clear stock - write down the difference in value to reflect new price That reminds me of what I read before from a book on financial statement. Should upgrade my memory chips! Ha. |
|
|
Apr 17 2013, 05:09 PM
Return to original view | Post
#37
|
|
Senior Member
4,761 posts Joined: Jun 2007 From: My house |
A query on asset depreciation.
Suppose company ABC bought a machine costing RM10 million yesterday. a. Who decides on the number of depreciation years? Guideline set by the tax dept? b. Who decides on the depreciation % for each year? % equally spreaded over the years? c. Possible to state, say, RM3 million for this year and the rest spreaded over 5 years? d. Sum of the depreciation amounts is equal to the actual purchase amount? With NO interest/inflation factor to adjust the amount due to the time period? e. In the P&L, Balance sheets etc, will the amounts stated follow the depreciation pattern? Sounds strange to me that I only state,eg, RM3 million for this year in the sheets when the actual cost is RM10 million. Many many thanks! |
|
|
Apr 18 2013, 09:43 AM
Return to original view | Post
#38
|
|
Senior Member
4,761 posts Joined: Jun 2007 From: My house |
QUOTE(gark @ Apr 17 2013, 05:43 PM) a. Depreciation rate set by own company, based on best financial practice and reasonable usable lifetime of item. Terima kasih, gark!b. Based on the rate set by company as above. Yes equally spread throughout the years. Different items can have different rate. c. No have to follow same percentage. Unless different item (although in a group purchase). d. Depreciation amount is full cost of purchase (include taxes, shipping, other costs) but not inclusive of inflation/interest. e. Yes in the PL will follow the set rate. Typical : Land = 0 deprecation Building = 20-30 years Biologicals = 16-20 years Machinery = 8-16 years Vehicles = 6-8 years Electronics/Computer/furniture/others = 2-5 years A company can define more and in much more detail. Depreciation CAN be manipulated to show artificially low/high P&L. However auditors can and should catch this as it is common. 1. Artificially high depreciation rate = tend to lower P&L & increase free cashflow. Used to suppress/hide profit. 2. Artificially low depreciation rate = tend to increase P&L & decrease free cashflow. Used to artificially increase profit. Of the above item 1 is a 'hidden value' mostly is very conservative company and item 2 is 'artificially boosted profit' and it is the most dangerous for obvious reasons. Average depreaciation rate can be counted via total depreciation/total fixed asset or total depreciation/cumulative capex. Item 1 example is Lindt chocolate, who used super high depreciation since the company is super conservative (Building 5 years & machinery 2 years), hence showing very little profit. Went undetected for quite some time until noticed by an American hedge fund, since then the stock has gone through the roof... Understand better now on this depreciation. Thanks for the hidden insight on the tricks companies use. I will get a magnifying glass now when I read the annual reports for both shorter and longer depreciation periods. Maybe some hidden gems as well as rotten apples there. You are really a walking computer with all the infor. I promise myself that I will not ask others for stocks to buy (I should do the necessary homework) and so I will not ask you that. But I can ask you for the winning 6D for this weekend! Ha. Just kidding. Cheerio. |
|
|
Apr 18 2013, 10:24 AM
Return to original view | Post
#39
|
|
Senior Member
4,761 posts Joined: Jun 2007 From: My house |
One more question from me. Sorry, lots of things come to mind while reading a book on stock investing.
The author is not in favour of company acquisition as most failed or diluted the ROE. Company A has ROE of 30% and bought a company B with ROE of 10%. Even when under company A, A cannot increase B's ROE from 10 to 30% that easily. Like to know what is the general outcome of company acquisitions in M'sia in the past (impact on acquirers) - better, no change or got worst? Understand that some CEO etc may like acquisitions as that will increase their power, market worth etc and thus a higher pay! Ha. Cheerio. |
|
|
Apr 26 2013, 01:34 PM
Return to original view | Post
#40
|
|
Senior Member
4,761 posts Joined: Jun 2007 From: My house |
Need to cross check with those who are doing intrinsic value calculations on whether my spreadsheet is about right or way off (not comparing the exact value but the ball-park value).
E.g. Petronas Gas using up to 2012 data, FCF growth rate of 5%, discount rate of 10% and perpetuity rate of 3%, I got RM4.7/share (vs current RM19.5/share). Using your method, do you get about RM5/share? Many thanks.  |
|
Topic ClosedOptions
|
| Change to: |  0.0258sec 0.0258sec
 0.63 0.63
 7 queries 7 queries
 GZIP Disabled GZIP Disabled
Time is now: 10th December 2025 - 12:30 PM |
 Quote
Quote