

QUOTE(dopp @ Dec 11 2020, 02:01 PM)
Mine not as good.. 
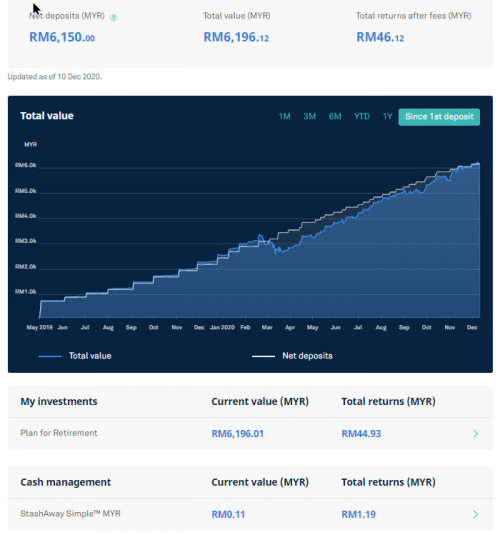

Would you mind posting the chart for the 36% portfolio? Also, did you change your portfolio risk level within this time period?Investment StashAway Malaysia, Multi-Region ETF at your fingertips!
|
|
 Dec 11 2020, 10:12 PM Dec 11 2020, 10:12 PM
Return to original view | Post
#1
|
 
Junior Member
78 posts Joined: Apr 2008 |
QUOTE(dopp @ Dec 11 2020, 02:01 PM) Mine not as good.. Would you mind posting the chart for the 36% portfolio? Also, did you change your portfolio risk level within this time period? |
|
|
|
|
|
Dec 17 2020, 02:31 PM
Return to original view | Post
#2
|
|
Junior Member
78 posts Joined: Apr 2008 |
QUOTE(lee82gx @ Dec 17 2020, 12:24 PM) Hi everyone, Well, you could obtain the expected returns from the code that generates those projection graphs. I have some data and maybe it is useless maybe it is useful. I am trying to compare Stashaway to my own DIY portfolio, with respect to risk and returns. For example if you look at Risk Index 36%, you are told there is a 1% chance of losing 36% of your investment in a year. The projected returns can be simulated in the website. By right based on the 2 statements you can derive the mean and also standard deviation based on a normal distribution. However I found that it is not matching. So, I ran some Monte Carlo analysis and reverse engineer the Standard deviation, here are the results: 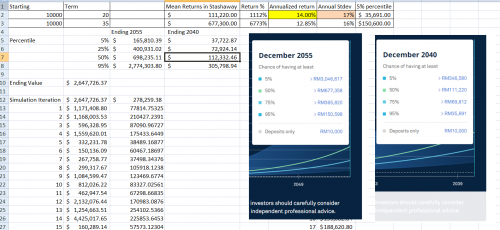 With a 1000 run Monte Carlo, I manage to get close to the projected returns in Stashaway. The matching return and Standard deviation is : 14% and 17% If you use this info to calculate a sharpe ratio with a risk free return rate of 2%, then the Sharpe Ratio is 0.71 You can now use this to compare against other funds. To me, my take away is if they maintain this in real life (you have to calculate your own std dev based on your own returns based on your DCA and cash flow) then it is actually not too shabby if it is maintained over a long period. I've yet to calculate the sharpe ratio of the actual historical performance, maybe I should. But I believe it is far exceed 1.0 for the past 2 years. Notes for readers
bourse, sidefulnes, and 3 others liked this post
|
|
|
Dec 21 2020, 03:35 PM
Return to original view | Post
#3
|
|
Junior Member
78 posts Joined: Apr 2008 |
Watched the video and it was disappointing. For someone who is a certified financial advisor, I'd expect a more considered view of investment products. Multiple forumers have mentioned the self-interest factor (udang disebalik batu?) so I'll just note other thoughts.
adele123, nugget_piece, and 13 others liked this post
|
|
|
Jan 1 2021, 11:43 AM
Return to original view | Post
#4
|
|
Junior Member
78 posts Joined: Apr 2008 |
For those who subscribe to the profit-taking ideology when investing in broad market investments, ask yourself this question: what would you do with the cash you have on hand? If you think you can predict the market better than pure luck consistently, I invite you to test your skills here: https://engaging-data.com/market-timing-game/ Quazacolt and polarzbearz liked this post
|
|
|
Jan 10 2021, 07:33 PM
Return to original view | Post
#5
|
|
Junior Member
78 posts Joined: Apr 2008 |
QUOTE(encikbuta @ Jan 10 2021, 05:27 PM) Time Weighted Return (TWR): This is your returns if THEORETICALLY you invested just once (lump sum) and never DCA ever. This is incorrect. The Time Weighted Return is the compounded ROI of each subperiod after accounting for deposits and withdrawals within that subperiod. Money Weighted Return calculation does not take into account the month-to-month performance and focuses entirely on deposits, dates, and final values. MWR returns large numbers when the period is short. Here's a comparison of ROI, TWR, MWR: 
QUOTE(Oklahoma @ Jan 10 2021, 06:45 PM) If TWR more than MWR, how? That means I suck? No. You cannot compare these two numbers against each other for the same portfolio and come to a conclusion. They are different ways of looking at a portfolio, as are other return measures like CAGR, etc. If you want to compare these numbers, you have to compare against the same numbers from other portfolios.This post has been edited by idyllrain: Apr 29 2023, 10:31 AM polarzbearz and Quazacolt liked this post
|
|
|
Jan 11 2021, 01:37 AM
Return to original view | Post
#6
|
|
Junior Member
78 posts Joined: Apr 2008 |
QUOTE(encikbuta @ Jan 10 2021, 10:03 PM) I could've sworn i got this right. refer this website. According to it, the TWR "is the return generated when you invest $1 at the beginning of the period while no money is added or taken out since then." The link you showed explains it that way because it is attempting to calculate a TWR for a fund.If you look at the mathematical formula shown on the page for the calculation, you can see that it is a compounded ROI of subperiods: R = [(1+r1)(1+r2)...(1+rn)]-1. You can also see that the definition for r1...rn is the ROI for a single subperiod: (value_curr + income - input + output)/value_prev. In their formula they’re using unit price (or NAV) for value_curr and value_prev. QUOTE(encikbuta @ Jan 10 2021, 10:03 PM) Your calculator is kinda echoing the same as well. Let's take the 2.13% subperiod TWR return figure on 30th Jun. You got that by taking the current month end net value (5200.89) minus the previous month end value (3134.15) minus the fresh deposit (2000). Then dividing it all by the previous month end value: Yes to calculate the TWR that is what we must do. There are 6 subperiods in that table. We need to get the ROI for each subperiods minus the net deposit and compound those. The Feb-May subperiod ROI = ((3134.15 - 2000)/1023)-1 = 0.1086 = 10.86%. The granularity of the subperiods is entirely up to us.(5200.89 - 3134.15 - 2000) / 3134.15 = 2.13% So what the table is essentially doing is removing the effects of the RM2000 deposit i.e. it is assuming no money is added or taken out after the first deposit. If we want the performance of RM 1 from the beginning until the end, we can just multiply each month’s return to get the final 17.06%. Alternatively if we have no deposits past the first month, calculating the TWR on a monthly subperiod will just give you the same 17.06%. QUOTE(Xenopher @ Jan 10 2021, 10:07 PM) I disagree. MWR lower than TWR actually means you time the market wrong. Hence putting lumpsum at the beginning and leave it (TWR) is higher than adjusted returns due to cash flows (MWR). This isn’t correct. MWR being higher or lower than TWR has nothing to do with rebalancing nor timing the market. The calculation for MWR seeks to find a rate of return (called the discount rate) so that the total cash inflow equals total cash outflow; in other words the net present value of all inflows and outflows equal 0. I have an old post that shows how this is computed manually. If you have Excel or GSheets, you can just use the function XIRR to compute this easily.If you DCA consistently and never try to time the market, your MWR will always be higher than TWR due to the auto rebalancing. Whether DCA’ing is better versus Lump Sum, or whether a higher DCA frequency is better depends entirely on opportunity costs and the increase/decrease of the average price you’re buying at. As such, DCA’ing into a market that is progressively more expensive will increase your average price; increased cost means your returns would be less. On the other hand, a market that is trending down will result in lower average prices. It should be obvious that if the market is going to be much more expensive 5 months later, a Lump Sum right now would result in lower prices. This post has been edited by idyllrain: Jan 11 2021, 02:16 AM Life_House, Quazacolt, and 2 others liked this post
|
|
|
|
|
|
Jan 11 2021, 02:30 AM
Return to original view | Post
#7
|
|
Junior Member
78 posts Joined: Apr 2008 |
QUOTE(pinksapphire @ Jan 11 2021, 01:31 AM) May I ask, if now the right time then to put lump sum into SA since USD exchange rate is low now? No one can answer this for you; you just have to decide what you believe the trend will be in the coming days. If USD weakens 5% relative to MYR and the ETFs increases 5% due to positive investor sentiment, the effects cancel out. If you are not comfortable committing a large sum of money in one transaction, you can always DCA first until you make a decision. |
|
|
Jan 11 2021, 03:57 PM
Return to original view | Post
#8
|
|
Junior Member
78 posts Joined: Apr 2008 |
QUOTE(Xenopher @ Jan 11 2021, 09:19 AM) I could be wrong but this is how I look at it. If everything else is constant, as in market increment/decrement rate over time (0% fluctuation), DCA amount, DCA frequency etc, the final calculated MWR will be exactly equals to TWR. Here's a comparison of the different rate of return formulas for various DCA strategies in 6 portfolios in different market patterns over 13 months where the underlying market grew 5.77%. 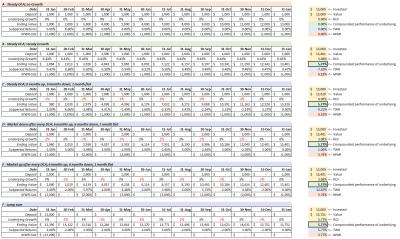
Try comparing the MWR against the TWR of Portfolio C, then do the same for Portfolio E; it doesn't tell you anything useful. However you can compare the MWR of Portfolio C vs the MWR of Portfolio E; it'll tell you that the money was used more efficiently in Portfolio C (ending ROI in C is higher). Edit: Updated table to fix MWR calculation mistakes as highlighted by WhitE LighteR. This post has been edited by idyllrain: Apr 29 2023, 10:31 AM polarzbearz, Quazacolt, and 2 others liked this post
|
|
|
Jan 11 2021, 08:44 PM
Return to original view | Post
#9
|
|
Junior Member
78 posts Joined: Apr 2008 |
QUOTE(xander83 @ Jan 11 2021, 08:34 PM) March 23 USDMYR was at 4.44 and it takes at least until 30 May to drop to 4.33 Even if you take the point where USD was the strongest vs MYR at 4.44292 on 24-Mar-2020 and the lowest point of 4.29552 on 3-May-2020, that drop is a mere 3.3% (4.29552-4.44292)/4.44292. If you're on the 36% portfolio, between those two dates, the portfolio has returned close to 10%. That is a net gain in MYR of 6.7% in the month of April alone.This post has been edited by idyllrain: Jan 11 2021, 08:46 PM polarzbearz liked this post
|
|
|
Jan 12 2021, 12:57 PM
Return to original view | Post
#10
|
|
Junior Member
78 posts Joined: Apr 2008 |
QUOTE(WhitE LighteR @ Jan 12 2021, 11:16 AM) i think there is a mis-calculation for Portfolio A. The final number should be 12000 not 13000. Because u are calculating for 12month period. To finalize the XIRR, on 31st Jan cannot have 1k additional. It needs to be zero. Because that is the month u tally your profit and u need to zero it out. If u add 1k XIRR will think its profit from December. Once u correct it, u will get XIRR 0% which is the correct calculation meaning no increase in value. You are right, I made a mistake in the calculation. Here's the fixed comparison @ 13k at 31st Jan:same correction have to made for other portfolio too. the final invested amount for all should be 12k. not 13k 
This post has been edited by idyllrain: Apr 29 2023, 10:28 AM polarzbearz and Quazacolt liked this post
|
|
|
Feb 5 2021, 12:18 PM
Return to original view | Post
#11
|
|
Junior Member
78 posts Joined: Apr 2008 |
QUOTE(ali00 @ Nov 10 2019, 02:34 PM) 2 months with SA now.. with 14% and 18% risk. I'm seeing -1.57% and -0.3% lol. Very funny QUOTE(ali00 @ Dec 11 2020, 11:11 AM) This is 36% risk? QUOTE(ali00 @ Dec 27 2020, 02:26 PM) Had 4k in SA for 1+ year divided into 3 portfolio - 14, 18, and 36%. My total ROI is 200 on 14% and 18%. 36% i'm not having any return due to many ups and down. Only 5%? Lmao gg QUOTE(ali00 @ Feb 4 2021, 08:28 PM) 2 years with SA and I'm still jealous of everybody returns. ☹️ Equals to ASB but ASB safer Probably changed to 22% risk between Dec 27 till now, and changed to 36% between between Dec 11 to 27.22% risk at 3.5% roi 36% risk at 5% roi |
|
|
Feb 14 2021, 02:26 AM
Return to original view | Post
#12
|
|
Junior Member
78 posts Joined: Apr 2008 |
QUOTE(Takudan @ Feb 14 2021, 02:08 AM) It was a lump sum (as per the previous screenshots, 20k). My SA risk index is 10% since inception, never changed that, never topped up nor withdrawn. My current portfolio value is RM19889 10% risk index only has 20% of the portfolio in equities (remaining 60% in bonds, 19% in gold, and 1% in cash). Bonds underperform equities in rising/recovering markets. Essentially what you did by taking the 10% risk index is declaring that you are worried about the volatility in the rising market, and wish to be more conservative.  yes it's a loss yes it's a lossGranted, I lost my referral bonus because I left my account idle for too long before I did anything about it, I lost the 6mo free management fee so there was that minor setback there. I am consciously holding back from investing any further into SA because the result's been disappointing really... wondering if I can/should do something about it? What you should do about it depends on your personal tolerance towards risk, and your investment time horizon. Do you think that the equities markets in US/China/Europe would continue to do well in the years ahead? If yes, then increasing your allocation to equities is something that you can do by changing your portfolio risk index higher. How much should you be in equities? Generally the younger you are, the longer your investment horizon can be (this depends on what you are investing for). The longer your investment horizon, you have more time to let your investment grow and recover from corrections and crashes, hence the higher the allocation to equities can be. Barricade, polarzbearz, and 3 others liked this post
|
| Change to: |  0.3780sec 0.3780sec
 0.59 0.59
 7 queries 7 queries
 GZIP Disabled GZIP Disabled
Time is now: 3rd December 2025 - 08:11 PM |
 Quote
Quote