

QUOTE(Juan86 @ Mar 10 2025, 03:20 PM)
whats the next pump news ? warren buy btc ?

Keyword " transition".
Bitcoin and other Cryptocurrencies, Comprehensive guide on first page.
|
|
 Mar 10 2025, 06:59 PM Mar 10 2025, 06:59 PM
Return to original view | IPv6 | Post
#521
|
 
Senior Member
3,625 posts Joined: Nov 2007 From: Hornbill land |
QUOTE(Juan86 @ Mar 10 2025, 03:20 PM) whats the next pump news ? warren buy btc ? Keyword " transition". ktek liked this post
|
|
|
|
|
|
Mar 11 2025, 08:06 AM
Return to original view | Post
#522
|
|
Senior Member
3,625 posts Joined: Nov 2007 From: Hornbill land |
QUOTE(dwRK @ Mar 11 2025, 07:47 AM) GM bro mois... congrats... you huat ahh... Belum phase E   . Just another LL. I think soon Lower high news should come out. You also huat wo . Just another LL. I think soon Lower high news should come out. You also huat wo  Anyways, I lost my passion to share TA here. But soon you gonna be my trading bot sifu.  This post has been edited by mois: Mar 11 2025, 08:11 AM |
|
|
Mar 28 2025, 05:54 PM
Return to original view | Post
#523
|
|
Senior Member
3,625 posts Joined: Nov 2007 From: Hornbill land |
QUOTE(colmi @ Mar 28 2025, 05:33 PM)  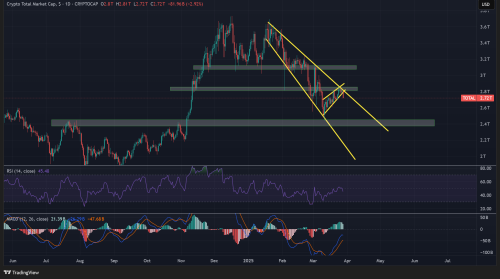 |
|
|
Apr 1 2025, 09:25 PM
Return to original view | Post
#524
|
|
Senior Member
3,625 posts Joined: Nov 2007 From: Hornbill land |
QUOTE(Vrese @ Apr 1 2025, 08:03 PM) @mois are you still tracking your wickoff thesis? Where are we now? Halfway inside Phase E I think. Not yet climax. There was Daily bullish divergence on 10 March. But without accumulation range. Between 92k and 73k is "void space". It has no levels to refer except Fibonacci.  I prefer to wait for 73k reaction if it ever comes. It was biggest resistance of all time. Now it turn into biggest support of all time lol. 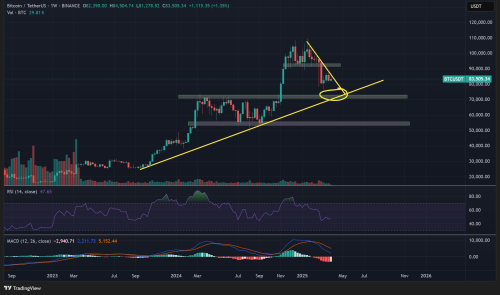 This post has been edited by mois: Apr 1 2025, 09:45 PM Vrese and stuala2003 liked this post
|
|
|
Apr 2 2025, 08:55 AM
Return to original view | IPv6 | Post
#525
|
|
Senior Member
3,625 posts Joined: Nov 2007 From: Hornbill land |
QUOTE(Vrese @ Apr 2 2025, 08:40 AM) I guess so too, we'll see small rebound here before continue downward which is not preferred. I hope market turn a bit bullish after this so called American liberation day Today isnt? 2nd April. Liberation Day. Lots of tariff announcement tonight. |
|
|
Apr 2 2025, 10:20 PM
Return to original view | Post
#526
|
|
Senior Member
3,625 posts Joined: Nov 2007 From: Hornbill land |
4am. That is when US market close.
|
|
|
|
|
|
Apr 3 2025, 11:10 AM
Return to original view | Post
#527
|
|
Senior Member
3,625 posts Joined: Nov 2007 From: Hornbill land |
QUOTE(colmi @ Apr 3 2025, 09:18 AM)  I guess crypto will follow stock futures and dip a little. In the past, news headline like "China ban crypto" is bear market trigger news in 2017. Tariff war is 10x uglier news than china ban crypto. So bitcoin really holding up very very solid. For example, Microstrategy stock is down almost -50% compare to bitcoin only down -23%. |
|
|
Apr 3 2025, 03:43 PM
Return to original view | Post
#528
|
|
Senior Member
3,625 posts Joined: Nov 2007 From: Hornbill land |
 I want to share something which you guys can help backtesting. CME GAP. CME gap is the hole left by btc pumping/dumping when the market is closed. I noticed, almost 97% gaps are filled with proper candle's body. Dont count the wicks. For example, last night there is new CME gap at 85100-86000. Maybe you guys can help me to find the missing gaps that hast been fill. CME Gap that I found. 1. 85100-86000 (latest one) 2. 77370 - 84485 (8-11 November 2024) 3. 9615 - 9935 (24 July -27 July 2020) 4. 20280 -21295 (10 March 2023) If 1 & 2 were to fill, I believe it will fill others as well. Timeframe I dont know. Tradingview tracker is BTC1! (Bitcoin Futures CME). Edited: Found another (4) 20280 -21295 10 March 2023. This post has been edited by mois: Apr 3 2025, 03:54 PM |
|
|
Apr 3 2025, 04:10 PM
Return to original view | Post
#529
|
|
Senior Member
3,625 posts Joined: Nov 2007 From: Hornbill land |
QUOTE(sleepwalker @ Apr 3 2025, 03:58 PM) I believe you already know that all gaps will eventually be filled. Most traders believe this but is usually used on a lower timeframe, within the day it is formed. I see this every few weeks in my forex trading and gaps formed on Mondays are usually filled by London session on the same day. However once it is not filled on Monday, the gap filling idea will be invalided and we forget about it. However, the previous close before the gap will be used as a weekly high/low (depending whether we gap up or down) that will be a target for liquidity to be filled in the future. I used Daily chart for btc. I guess daily chart for btc can consider big time frame in crypto world. This one is interesting one. December 2020 gaps filled in June 2022. Today is the first time I analyze CME gap and it look really interesting. Back then I just ignored it.  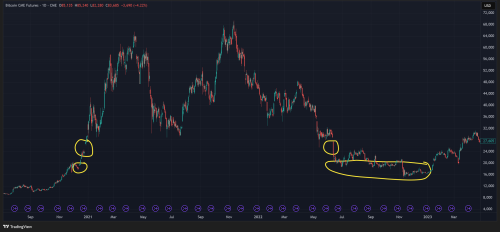 |
|
|
Apr 3 2025, 04:53 PM
Return to original view | Post
#530
|
|
Senior Member
3,625 posts Joined: Nov 2007 From: Hornbill land |
QUOTE(sleepwalker @ Apr 3 2025, 04:37 PM) Reason for it to be on small timeframe is because on longer time frame it is no longer a viable strategy. 2 years to fill a gap is not a strategy. It's just an eventuality. A gap is usually a reaction over a weekend event that is reflected on Monday when the market opens. The gap is a short term reaction and should not be used for a long term strategy. Like I said, once the gap is not filled, it is considered as failed and the previous week's level becomes the next high/low to be targeted but no longer have a fix timeframe to do so. I think you got my message wrong about CME gap. I am not talking about the trading strategy based on CME gap. More like toward eventuality like you said. Yeah recently the gaps acts like magnet reaction. Over the last 2 months, selling gaps eventually filled. Do you personally form a strategy based on short term gap? Or just ignore it? There should be a target within an achievable timeframe which is why gap filling is usually looked at on how the market reacts on Monday. Your gap wasn't filled in 2022. The gap fill was considered failed on the day after it was formed in 2020. You don't hold a gap for 2 years and call it something to look at. 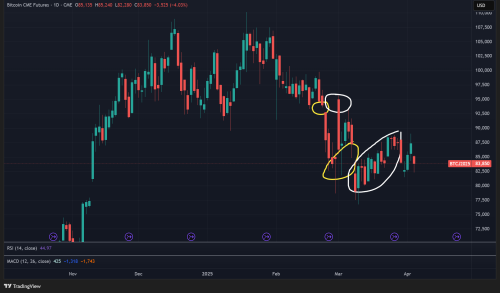 |
|
|
Apr 3 2025, 08:35 PM
Return to original view | Post
#531
|
|
Senior Member
3,625 posts Joined: Nov 2007 From: Hornbill land |
QUOTE(dwRK @ Apr 3 2025, 06:49 PM) dun pay too much attention to gaps... price actions/movements are more important... this determines if a gap will be filled or not within a reasonable time frame say within a week or so... anything more than that ppl are just making up stories to fill their content... Alright. Only little attention should be suffice since it cannot provide any trading strategy. Imagine it created a gap to be filled 2-5 years later.  a gap will always attract attention... this is herd mentality... But still, the gaps are really interesting. Before today, I totally ignored it. Anyways, lets see 10pm later. SPX Futures is down -3%. |
|
|
Apr 4 2025, 01:29 PM
Return to original view | Post
#532
|
|
Senior Member
3,625 posts Joined: Nov 2007 From: Hornbill land |
QUOTE(dwRK @ Apr 3 2025, 10:16 PM) for sure spx gonna gap down 0% movement btc for -4.8% SPX. Incredible  Even MicroStrategy is almost -10%. |
|
|
Apr 7 2025, 08:09 AM
Return to original view | IPv6 | Post
#533
|
|
Senior Member
3,625 posts Joined: Nov 2007 From: Hornbill land |
QUOTE(brokenbomb @ Apr 7 2025, 07:14 AM) march 2020 vibes Dont know why crypto lag 3-4 days for drop to happen. Maybe preparing for black monday tonight? |
|
|
|
|
|
Apr 7 2025, 08:56 AM
Return to original view | Post
#534
|
|
Senior Member
3,625 posts Joined: Nov 2007 From: Hornbill land |
QUOTE(mois @ Feb 24 2025, 05:10 PM) Lately I learn new thing and I backtested it toward 2021. Which is USDT dominance Weekly chart. I want to update this USDT dominance weekly chart.USDT dominance go up = bitcoin go down USDT dominance go down = more money flow into bitcoin and up. 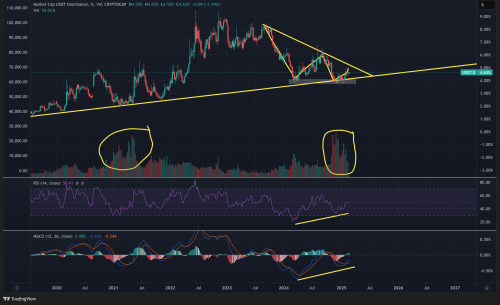 1. Volume has spiked. 2. It is sitting on 0.786 Fibonacci retracement. 3. Weekly bullish divergence on both RSI and MACD. Monthly RSI bullish divergence. 4. W shape consolidation. ABC elliot waves are finished. The wave C finish at 3.82%. 5. Now just waiting for the USDT. Dominance breakout from the trendline. Below is chart USDT. dominance vs bitcoin price in weekly timeframe.  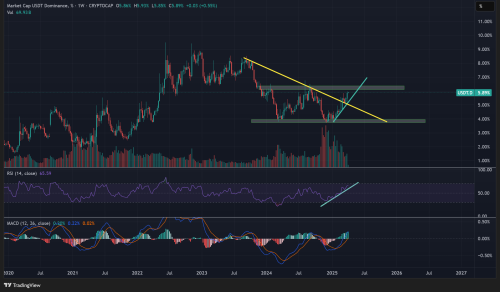 USDT dominance has clear breakout from trendline just now at 8am (weekly closed). But it hasn't break above the W neckline (6.2%) . I think the real bloodbath (phase E climax) is when it break above W neckline. Another thing. There is a new big CME GAP at 79565 -82870. My new theory, if gap is always fiiled, there might be a Lower high at 83k-84k (movement like this is intended to liquidate high leverage shorts). But I would pay little attention as advised earlier. But still, just new theory I am interested with. This post has been edited by mois: Apr 7 2025, 08:57 AM |
|
|
Apr 7 2025, 01:49 PM
Return to original view | Post
#535
|
|
Senior Member
3,625 posts Joined: Nov 2007 From: Hornbill land |
QUOTE(sleepwalker @ Apr 7 2025, 01:35 PM) For BTC it's still closing lower than opening (short by USD10) on the hourly charts and making new lows. Until it closes above this morning's open on the hourly chart, there is little indication that it will chase after the gap. |
|
|
Apr 7 2025, 02:40 PM
Return to original view | Post
#536
|
|
Senior Member
3,625 posts Joined: Nov 2007 From: Hornbill land |
QUOTE(sleepwalker @ Apr 7 2025, 02:27 PM) If you look at candle stick patterns, almost every candle stick has a wick or shadow above and below opening/closing price. Today's BTC day candle does not have a wick above the opening price. Therefore the opening price will be the first target (not the GAP) that BTC needs to close above before it can progress further. The question now is are there sellers all lined up above the opening price to continue pushing the price down. There is never a certainly a gap will be closed and that is why I said Gap Closing is a very short term play. After that other price action levels will takeover and the gap fill is considered failed. Alright. Probably need to ignore the gap like I used to. Anyways, lets see the action tonight. So many calling for Black Monday. |
|
|
Apr 9 2025, 06:17 AM
Return to original view | Post
#537
|
|
Senior Member
3,625 posts Joined: Nov 2007 From: Hornbill land |
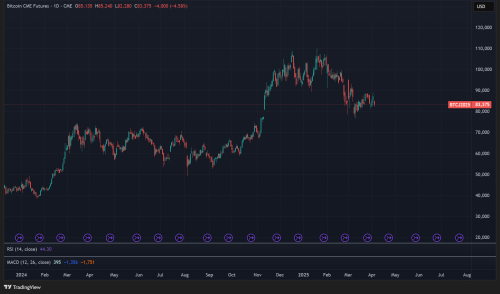
3k more toward 73k. If if history is repeating, this is where i think they drop the nuke like in late 2021 53k support. I was there , live.
This post has been edited by mois: Apr 9 2025, 06:27 AM |
|
|
Apr 9 2025, 07:58 AM
Return to original view | Post
#538
|
|
Senior Member
3,625 posts Joined: Nov 2007 From: Hornbill land |
QUOTE(sleepwalker @ Apr 9 2025, 07:39 AM) The next level it needs to hit first is 67K, the sell into buy 2 days before Trump winning the election on 4th of November. That would be the level to watch before 59K and then 53K. Also 53K support level is at Sept 2024, not 2021. You don't look at that 2021 high and call that support. You look at the latest low to call for support and that would be Sept 2024 at 53K. I think you misunderstood again. I was referring this late 2021 as history were to repeat. To repeat or not is another matter.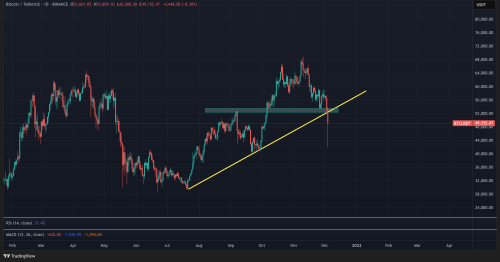 Now 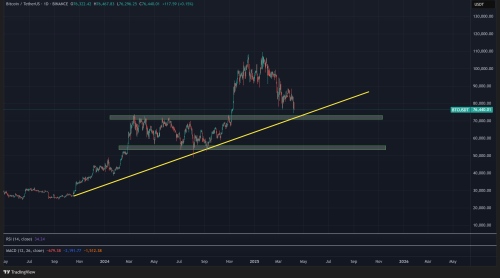 This post has been edited by mois: Apr 9 2025, 08:01 AM oOoproz liked this post
|
|
|
Apr 9 2025, 02:27 PM
Return to original view | Post
#539
|
|
Senior Member
3,625 posts Joined: Nov 2007 From: Hornbill land |
QUOTE(dwRK @ Apr 9 2025, 09:47 AM) my turn to blow water... hehehe... You use what platform to short? |
|
|
Apr 10 2025, 07:18 AM
Return to original view | Post
#540
|
|
Senior Member
3,625 posts Joined: Nov 2007 From: Hornbill land |
QUOTE(sleepwalker @ Apr 10 2025, 07:14 AM) Trump pauses tariff on some countries for 90 days and imposes 125% on China. I thought only crypto space he can do such manipulation. Didnt know he can do it on stocks also He's either a damn idiot or a freaking genius. This was his plan all along. Epic market manipulation. |
| Change to: |  0.0888sec 0.0888sec
 1.03 1.03
 7 queries 7 queries
 GZIP Disabled GZIP Disabled
Time is now: 27th November 2025 - 08:36 AM |
 Quote
Quote