

Double post sory
This post has been edited by mois: Feb 4 2025, 04:10 PM
Bitcoin and other Cryptocurrencies, Comprehensive guide on first page.
Bitcoin and other Cryptocurrencies, Comprehensive guide on first page.
|
|
 Feb 4 2025, 01:55 PM Feb 4 2025, 01:55 PM
Return to original view | IPv6 | Post
#481
|
 
Senior Member
3,625 posts Joined: Nov 2007 From: Hornbill land |
Double post sory
This post has been edited by mois: Feb 4 2025, 04:10 PM |
|
|
|
|
|
Feb 4 2025, 01:58 PM
Return to original view | IPv6 | Post
#482
|
|
Senior Member
3,625 posts Joined: Nov 2007 From: Hornbill land |
QUOTE(dwRK @ Feb 4 2025, 12:42 PM) what else do you see? Total market cap. Weekly divergence + macd crossed this week. Can this be ignored? Time will tell tho. early on, prices poking bottom... now prices poking top... early on, prices poking bottom... now prices poking top... so forget your weekly divergence for now... see price action first...  deepseek here... tariff war there... nothing to see lah... hahaha...  Btc weekly macd hasnt cross. Just total market cap crossed. 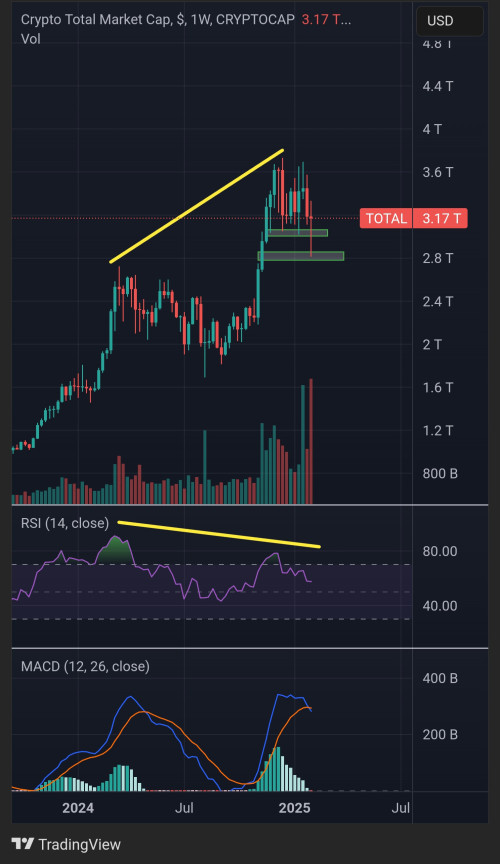 This post has been edited by mois: Feb 4 2025, 02:00 PM |
|
|
Feb 14 2025, 10:25 AM
Return to original view | IPv6 | Post
#483
|
|
Senior Member
3,625 posts Joined: Nov 2007 From: Hornbill land |
QUOTE(Syok Your Mom @ Feb 13 2025, 08:06 PM) Bought RM 5000 yesterday at RM 425k sold this morning at RM 437k. Profit RM 47. For me quick money is pretty fun. Looks like the price can't top $100k again. Trump's Bitcoin hot air promises is melting like Antarctica iceberg Lately got ask god and goddess puak pai?This post has been edited by mois: Feb 14 2025, 10:26 AM |
|
|
Feb 15 2025, 08:12 AM
Return to original view | Post
#484
|
|
Senior Member
3,625 posts Joined: Nov 2007 From: Hornbill land |
Total market cap vs btc on Daily chart. See which one is true.
Total market cap is below trendline. But bounced from support. 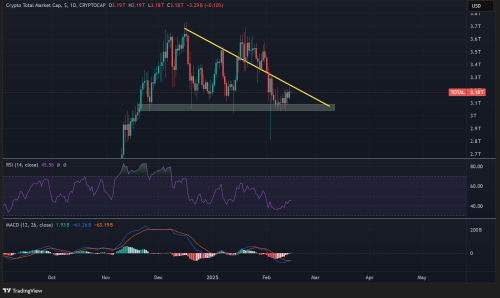 BTC is above trendline all these while. Bounce non stop. 15 times bounce. My personal wyckoff chart is doing the Jump Across Creeks (JAC) in re-distribution.  Altcoin market cap. Already below support level but it bounced from 0.618 golden Fibonacci retracement level. Support turned resistance area is key level to break above and bullish (1.32T). If cannot break, probably will fill the wick at 1T level.  My past experiences I always trust the market cap to an extend I said market cap never lies. Lets wait again. So far I do not detect any bullish divergences on 4H or 1D chart. This post has been edited by mois: Feb 15 2025, 09:01 AM |
|
|
Feb 15 2025, 09:33 AM
Return to original view | Post
#485
|
|
Senior Member
3,625 posts Joined: Nov 2007 From: Hornbill land |
QUOTE(Vrese @ Feb 15 2025, 09:23 AM) More waiting? Yeah. Already 3 months inside the range. But altcoin market cap dived first.QUOTE(brokenbomb @ Feb 15 2025, 09:27 AM) more time to accumulate Accumulate SB_T  This post has been edited by mois: Feb 15 2025, 09:46 AM brokenbomb liked this post
|
|
|
Feb 20 2025, 11:13 PM
Return to original view | Post
#486
|
|
Senior Member
3,625 posts Joined: Nov 2007 From: Hornbill land |
SP500 drop but total market cap can hold its own. Not bad.
Bitcoin really decoupled from SP500 since Trump inauguration. |
|
|
|
|
|
Feb 22 2025, 08:40 AM
Return to original view | Post
#487
|
|
Senior Member
3,625 posts Joined: Nov 2007 From: Hornbill land |
Crypto ETFs are already here. If people still sticking with shitcoin and exchanges, this is the risks people are playing with.
You are better off with FSM, Moomoo, IBKR. Use these platform to buy/sell bitcoin ETF. If you guys think bitcoin volatility isnt enough, buy the x2 version. That way, you dont need expose yourself to shitcoin which is 3-5x bitcoin movement. Which most of time altcoin get rekt. |
|
|
Feb 22 2025, 10:44 AM
Return to original view | Post
#488
|
|
Senior Member
3,625 posts Joined: Nov 2007 From: Hornbill land |
QUOTE(GalaxyV @ Feb 22 2025, 10:14 AM) FSM Malaysia? I use FSM malaysia and MooMoo. Got products from grayscale, blackrock, proshare. They are only open to buy/sell like normal trading hour in US. 1030pm-5am Malaysia time. That is why 1030pm onward usually movement come out. How to buy or sell in IBKR for ETF? Long and short. If long, IBIT (1x), BITX(2x), BITU(2x). Got others as well. 1x more or less like spot btc. If short , BITI(-1x) , SBIT(-2x). Got others too. For bitcoin ETF if not mistaken, it is just leverage 1x and 2x. Both directions. If exchange like bybit and binance, it can go 1x to 100x. But ready to face liquidation. Exchanges boss wont let you earn their money easily. Yesterday Bybit hacked 1.5bil? Last 2 weeks they gain 2.1bil from liquidations from a single day. https://cointelegraph.com/news/bybit-lifts-...timated-figures QUOTE(dwRK @ Feb 22 2025, 10:24 AM) nah... shitcoins is where the fun is It is fun for those who can read chart.   . For those who trade without charting (gut feeling), . For those who trade without charting (gut feeling),  This post has been edited by mois: Feb 22 2025, 10:53 AM |
|
|
Feb 22 2025, 11:33 AM
Return to original view | Post
#489
|
|
Senior Member
3,625 posts Joined: Nov 2007 From: Hornbill land |
QUOTE(kent2010 @ Feb 22 2025, 10:42 AM) How to trade in consolidation? Identify big ranges like parallel channels and support & resistance. These you need to take the profit and loss in a disciplined way. If you get greedy for wanting more %, suddenly the price went against you, the paper profit become real loss. This is simple example of support. Bounce 8 times. Example you buy 8 times x 5%= 40% already. Breakout either way, you cant gain 40% anyways. 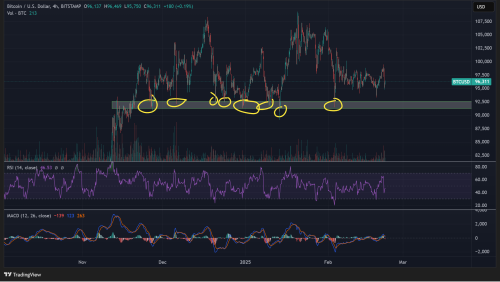 Support and resistance is the most basic and the most powerful thing to see in a chart. It is so easy. Just draw a box where the price keep bounce and reject (resistance). This post has been edited by mois: Feb 22 2025, 11:45 AM kent2010 liked this post
|
|
|
Feb 23 2025, 09:30 AM
Return to original view | Post
#490
|
|
Senior Member
3,625 posts Joined: Nov 2007 From: Hornbill land |
Since ETH is hot topic now. Despite the hack, the price isnt affected. Just consolidating.
ETH my view 4H chart. If this bearish triangle breakdown, the flagpole target is sub 2k. $2100 is very strong support. But like I said, triangle is difficult one. It could break above too. If it break out above, triangle target is $3100+.  But ETH 1D chart on logarithmic view. It is being supported by the bullish trendline. So any breakdown of the trendline, it become bearish trend for ETH. But as long still above and bouncing ok lah. 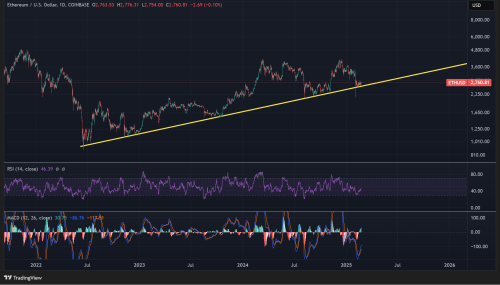 This post has been edited by mois: Feb 23 2025, 09:50 AM |
|
|
Feb 24 2025, 05:10 PM
Return to original view | Post
#491
|
|
Senior Member
3,625 posts Joined: Nov 2007 From: Hornbill land |
Lately I learn new thing and I backtested it toward 2021. Which is USDT dominance Weekly chart.
USDT dominance go up = bitcoin go down USDT dominance go down = more money flow into bitcoin and up. 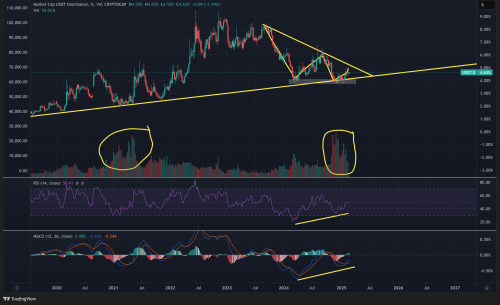 1. Volume has spiked. 2. It is sitting on 0.786 Fibonacci retracement. 3. Weekly bullish divergence on both RSI and MACD. Monthly RSI bullish divergence. 4. W shape consolidation. ABC elliot waves are finished. The wave C finish at 3.82%. 5. Now just waiting for the USDT. Dominance breakout from the trendline. Below is chart USDT. dominance vs bitcoin price in weekly timeframe.  |
|
|
Feb 25 2025, 08:18 AM
Return to original view | IPv6 | Post
#492
|
|
Senior Member
3,625 posts Joined: Nov 2007 From: Hornbill land |
 |
|
|
Feb 25 2025, 03:10 PM
Return to original view | IPv6 | Post
#493
|
|
Senior Member
3,625 posts Joined: Nov 2007 From: Hornbill land |
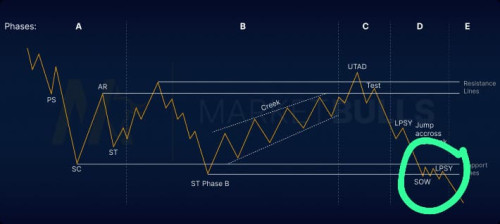
Phase E today?
|
|
|
|
|
|
Feb 25 2025, 03:25 PM
Return to original view | IPv6 | Post
#494
|
|
Senior Member
3,625 posts Joined: Nov 2007 From: Hornbill land |
QUOTE(doraemonkiller @ Feb 25 2025, 03:12 PM) u still own btc? No more. But ETF side im on opposite direction tho. |
|
|
Feb 25 2025, 09:35 PM
Return to original view | Post
#495
|
|
Senior Member
3,625 posts Joined: Nov 2007 From: Hornbill land |
Daily btc chart. First time below major support and below the major trendline that it bounced 15 times. If today dump become scam wick and by tomorrow morning closed at 92k again. I salute the manipulator/composite man.
 . Daily candle closes at 8am everyday. So 11 hours to go. . Daily candle closes at 8am everyday. So 11 hours to go. 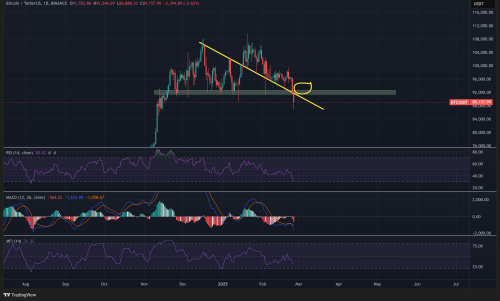 This post has been edited by mois: Feb 25 2025, 09:38 PM |
|
|
Feb 25 2025, 10:47 PM
Return to original view | Post
#496
|
|
Senior Member
3,625 posts Joined: Nov 2007 From: Hornbill land |
QUOTE(dwRK @ Feb 25 2025, 10:29 PM) maybe 1 more day parabolic down to 78k... My tikam figure is wick toward 74k if Phase E.  This post has been edited by mois: Feb 25 2025, 10:49 PM |
|
|
Feb 26 2025, 08:10 AM
Return to original view | Post
#497
|
|
Senior Member
3,625 posts Joined: Nov 2007 From: Hornbill land |
QUOTE(Juan86 @ Feb 26 2025, 12:27 AM) good days are over If you go read reddit, they are completely opposite. even gold tank Buying the dip This is shakeout One leg down before real bullrun Bear trap Be greedy when people are fearful I dont know if those are real people or bots designed by whales. This post has been edited by mois: Feb 26 2025, 08:10 AM |
|
|
Feb 26 2025, 10:09 PM
Return to original view | Post
#498
|
|
Senior Member
3,625 posts Joined: Nov 2007 From: Hornbill land |
|
|
|
Feb 27 2025, 12:54 PM
Return to original view | Post
#499
|
|
Senior Member
3,625 posts Joined: Nov 2007 From: Hornbill land |
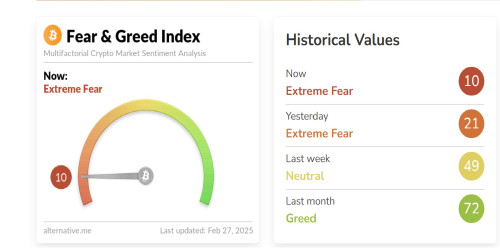 Today greed and fear index. 10. In my memory, I have not seen this low figure before. |
|
|
Feb 28 2025, 10:11 AM
Return to original view | IPv6 | Post
#500
|
|
Senior Member
3,625 posts Joined: Nov 2007 From: Hornbill land |
QUOTE(GalaxyV @ Feb 28 2025, 09:59 AM) time to jump from level 11? Belum. Total market cap still on support.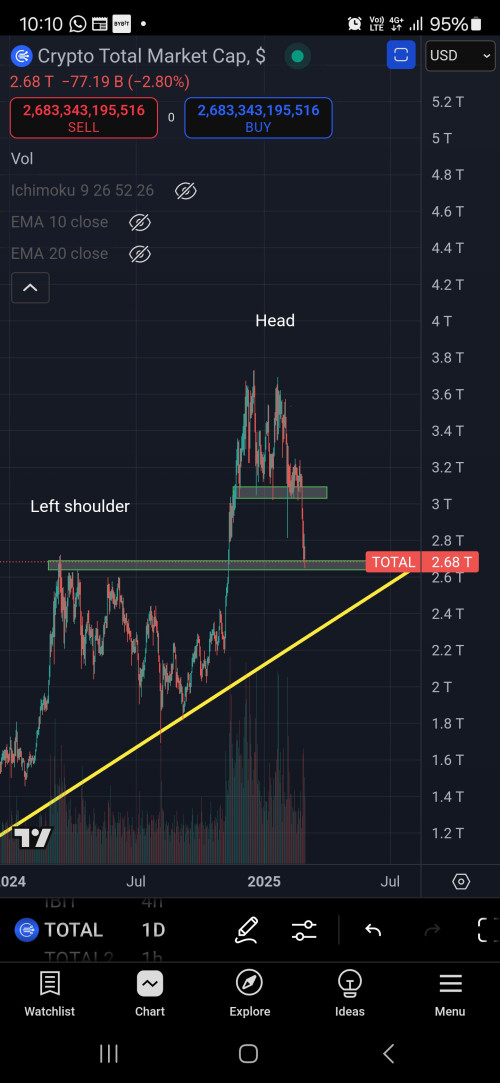 |
| Change to: |  0.0748sec 0.0748sec
 0.79 0.79
 7 queries 7 queries
 GZIP Disabled GZIP Disabled
Time is now: 28th November 2025 - 06:40 AM |
 Quote
Quote Rekt upside down.