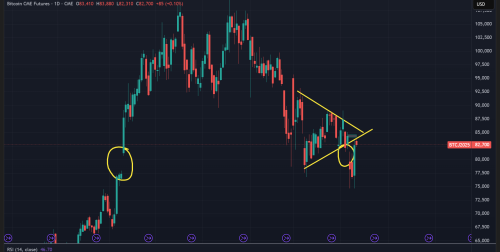
Manage risk accordingly if want fomo. Me think is better to wait after 95k break to invalidate the "Throwback". Total market cap chart is quite different from BTC chart. Total market cap not yet break out previous high 2.82T yet...
Edited : Market cap break 2.82T!
This post has been edited by mois: Apr 23 2025, 09:12 AM
Actually now some altcoin looking attractive. Last few months I was bearish, but since it has crashed 50+%. Now suddenly feeling bullish. I see daily chart bullish divergence everywhere on RSI & MACD. My turn to puak pey ask my god can buy or not before trump jinkx it hahaha!.
It is like that everywhere. Some people crypto portfolio is less than 20% BTC. The rest is altcoin. That's why been quite because our alt bags havent pump strong. BTC pump, alts sideway. BTC dump, alt dump 2x harder.
Look like btc.dominance dropping for now.
This post has been edited by mois: May 22 2025, 04:20 PM
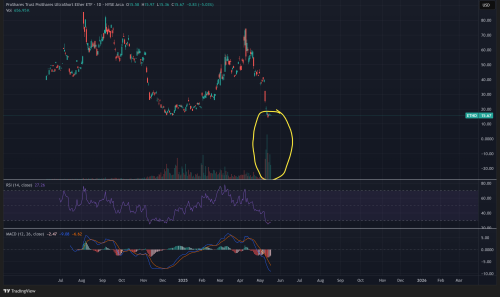
I want to share something about BTC ETF. Particularly SBIT (short x2) since I like to monitor ETF activity.
The trading volumes is insanely high for the last 6 month especially when BTC around 100k region. Last year when btc 73k, the trading volume is very small. Above chart is our retail tradingview information based on NYSE ARCA.
Here is the interesting part. The Dark Pool. Dark Pool is off exchange activity. Meaning they dont trade on regular exchange like NYSE ARCA. Dark Pool is where institution trade wholesale lots. As for SBIT, the dark pool volume is 50%. NYSE ARCA is just 12%. Meaning the above chart volume represent only 12% trading volume. Last night 21 May 2025, Dark Pool SBIT spike the highest (refer to white bar). And last year 73k area, the Dark Pool activity (white bar) is almost non existent. Link below is Dark Pool volume.
I cannot conclude anything. But based on last year, institution has no interest to short. But for the last 6 months, volume has spiked. I dont know if institution trade against each other or not especially inside the dark pool. But so far the high volumes are still red, not yet turn green.
This post has been edited by mois: May 22 2025, 08:47 PM
Get ready for a FTX Sam Bankman type scandal or North Korea hackers news to dip the Bitcoin price then only can buy, now the price really too high dy.
Trump is starting "Tariff on" mode by slamming 50% tariff on EU. We get rally during his "Tariff off" 90 days period. He control both crypto and stocks now. 90 days from April 11 is somewhere in early July.
This post has been edited by mois: May 24 2025, 02:39 PM
Wow, back to 1500? The chart looks eeriely similar
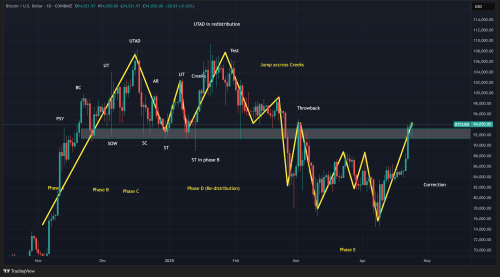
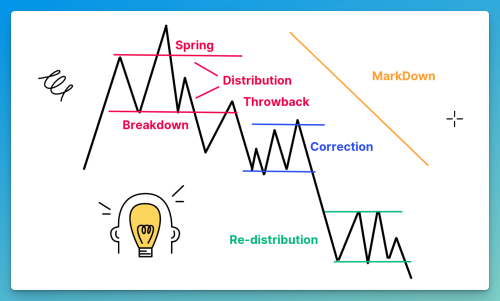
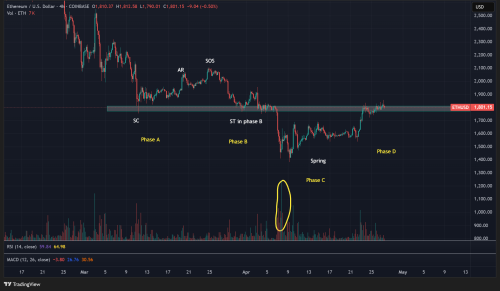
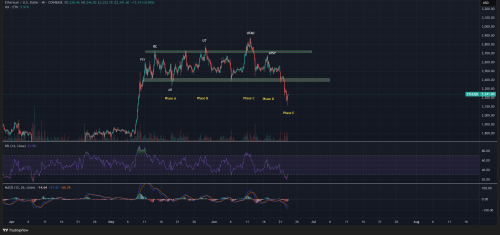
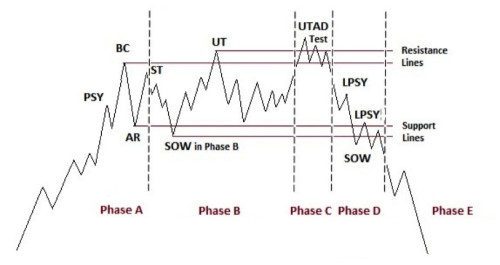
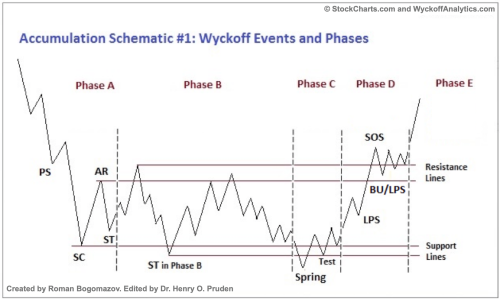
Crypto tend to follow alot of wyckoff method to hide their true intention. Remember past few months tariff war February-April? It was accumulation. Can sendiri judge how similar they copy the schematic. I only help do labelling. Normally one wyckoff cycle can last 2-6 months.
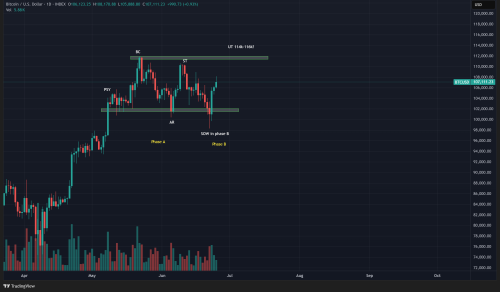
As for current cycle ever since 8 May 2025, so far only 48 days. I am tracking distribution schematic #2. The Iran war 98k look like a SOW to me. So potential 114k-116k as UT? I also not sure.
» Click to show Spoiler - click again to hide... «
This post has been edited by mois: Jun 25 2025, 11:40 PM


 Apr 10 2025, 10:21 AM


 Quote
Quote


 0.0726sec
 0.87
0.87
 7 queries
 GZIP Disabled