

 Feb 5 2015, 06:03 PM
QUOTE(RED-HAIR-SHANKS @ Feb 5 2015, 05:44 PM)
I've stuck in this question before. Here, let me give you a hint that will kick-start your momentum in solving this question:
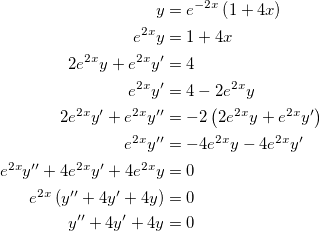
Multiply both the LHS and RHS of the equation by .
.
I think I know why you're having a trouble with this question because I was having the same problem too. There are possibly many ways for you to solve it, either by multiplying the into the parentheses, or by using product rule. But, I've done it using both said methods and I still couldn't prove the equation albeit going through a lot of steps. The thing here is that you have to know which is the simplest method that you can execute in order to arrive at the correct solution. chocobo7779 taught me this, and it's called Occam's Razor.
So you also knew about Occam's Razor. It is the mentality thing. Multiply both the LHS and RHS of the equation by
.I think I know why you're having a trouble with this question because I was having the same problem too. There are possibly many ways for you to solve it, either by multiplying the
into the parentheses, or by using product rule. But, I've done it using both said methods and I still couldn't prove the equation albeit going through a lot of steps. The thing here is that you have to know which is the simplest method that you can execute in order to arrive at the correct solution. chocobo7779 taught me this, and it's called Occam's Razor.
Most Malaysian students are taught to work out the given problem directly, without recognizing the root of the problem and find a workaround to it. chocobo7779's method was commendable.
 Quote
Quote


 0.0326sec
 0.54
0.54
 6 queries
 GZIP Disabled