

 Apr 15 2015, 01:50 PM
QUOTE(scgoh123 @ Apr 14 2015, 08:59 PM)
Yes it does make sense. Thanks 
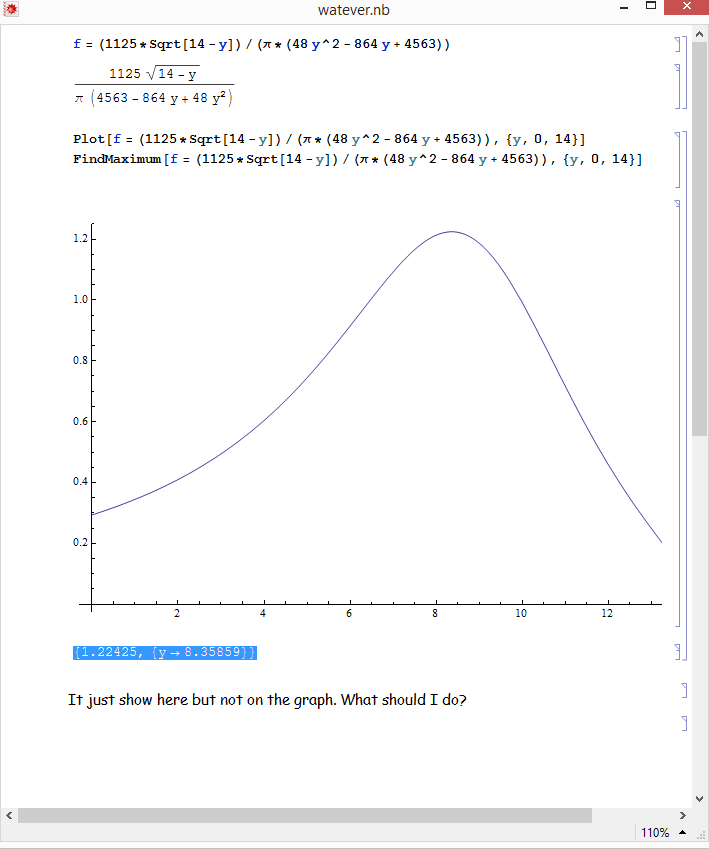
I have plotted the graph in wolfram mathematica, but how to show the coordinates of maximum point in the graph?
In Mathematica, the maximum of an expression that is a function of one variable can be found with I have plotted the graph in wolfram mathematica, but how to show the coordinates of maximum point in the graph?
CODE
FindMaximum[{expr [x]},{x,xo,xl,xu}]
where expr is a function of x, xo is the initial guess for the search for the minimum or maximum, xl is the lower bound for the search region, and xu is the upper bound for the search region. Both xl and xu are optional.
If you use WolframAlpha online, just type:
CODE
turning point [expr]
Then, move your mouse cursor to the red dot to display the coordinates. And that's for the first graph.

This post has been edited by Critical_Fallacy: Apr 15 2015, 01:52 PM
 Quote
Quote
 A quick shortcut is to use the
 You need the minds of a Mathematician + an Engineer to craft this Magical Box!


 0.0342sec
 0.88
0.88
 7 queries
 GZIP Disabled