QUOTE(RED-HAIR-SHANKS @ Feb 17 2015, 04:20 PM)
Question:
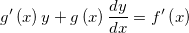
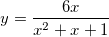
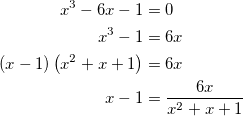
First problem(i)-If
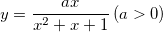
, show that
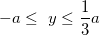
for all real values of
x.
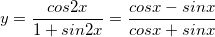
Second problem(ii)-Sketch the graph for
y in the case when
a=6.
As shown in (i), the function f(x) = 6x / (x² + x + 1) is bounded between –6 ≤ y ≤ 2 for all real values of x. The minimum y = –6 occurs at x = –1, and the maximum y = 2 occurs at x = 1.
The basic technique to sketch the graph of a rational function is to find the asymptotes and the intercepts. However, this method doesn't work well for the function f(x) in this question. Therefore, you need to employ the gradient method.
(1) Obtain the gradient:
dy/dx = f'(x) = –6(x² – 1) / (x² + x + 1)².
(2) Find the turning points (local extrema) of the gradient. These points mark the maximum steepness at certain x values.
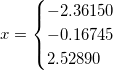
x = –1.5321, –0.3473, 1.8794
(3) Calculate f'(x) and f(x) for a set of selected x values: [–2, –1.5321, –1, –0.5, –0.3473, 0, 0.5, 1, 1.8794, 2]
| x | f'(x) | f(x) |
| –2.0000 | –2.0000 | –4.0000 |
| –1.5321 | –2.4534 | –5.0642 |
| –1.0000 | 0.0000 | –6.0000 |
| –0.5000 | 8.0000 | –4.0000 |
| –0.3473 | 8.8230 | –2.6946 |
| 0.0000 | 6.0000 | 0.0000 |
| 0.5000 | 1.4694 | 1.7143 |
| 1.0000 | 0.0000 | 2.0000 |
| 1.8794 | –0.3696 | 1.7588 |
| 2.0000 | –0.3673 | 1.7143 |
(4) Plot the graph using the data and by tracing the slopes.


 Jan 29 2015, 09:00 AM
 . Where were my errors? I redid it again and again, but I failed to get to the solution. It's frustrating.
 Quote
Quote ,
,

 [attachmentid=4331390]
 .
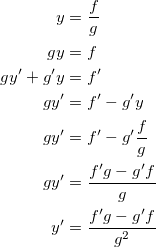
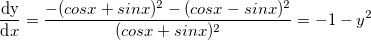
. into the parentheses, or by using product rule. But, I've done it using both said methods and I still couldn't prove the equation albeit going through a lot of steps. The thing here is that you have to know which is the simplest method that you can execute in order to arrive at the correct solution.


 .
.


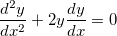
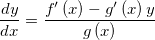
 , find
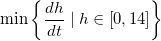
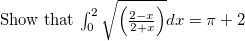
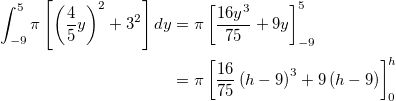
 is given and
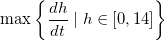
  can be obtained from the derivative of 1(b), the rest is Algebra and you can find the extrema on the closed interval
  .
. 
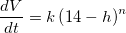
 , it all goes back to the quadratics.


 0.0469sec
 0.82
0.82
 7 queries
 GZIP Disabled