


Bursa Trader V4
Bursa Trader V4
|
|
 Apr 28 2014, 11:44 PM Apr 28 2014, 11:44 PM
|
 
Senior Member
2,635 posts Joined: Jun 2011 From: bohtakchik |
Think i got it. As long as high volume of selling, plus also quite consistent...DESPITE PRICE INCREASING... its distribution
|
|
|
|
|
|
Apr 28 2014, 11:44 PM
|
|
All Stars
15,942 posts Joined: Jun 2008 |
QUOTE(lambethwalk @ Apr 28 2014, 11:41 PM) Ooops, just saw this... looking at it now Ok let me show you another chart of a strong uptrend stock.Compare the volume..... wait 2 mins |
|
|
Apr 28 2014, 11:45 PM
|
|
Senior Member
1,177 posts Joined: Nov 2007 |
I'm missing something here. What does distribution mean in this context?
|
|
|
Apr 28 2014, 11:47 PM
|
|
All Stars
15,942 posts Joined: Jun 2008 |
QUOTE(Boon3 @ Apr 28 2014, 11:44 PM) Ok let me show you another chart of a strong uptrend stock. lambethwalkCompare the volume..... wait 2 mins  Compare a 'normal' strong uptrend stock....  this one is VIS.... 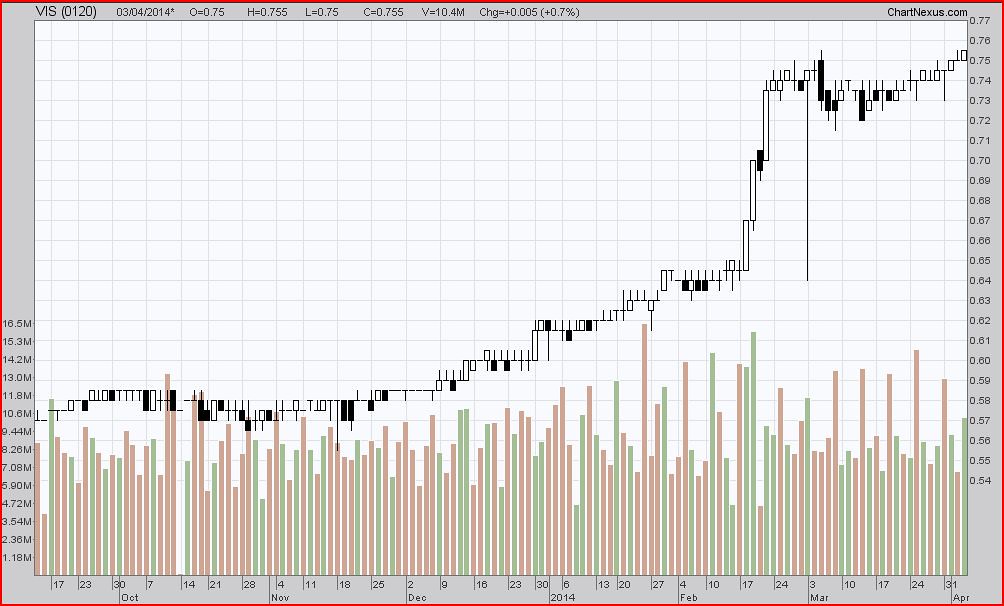 Not the difference?  |
|
|
Apr 28 2014, 11:50 PM
|
|
All Stars
15,942 posts Joined: Jun 2008 |
QUOTE(lambethwalk @ Apr 28 2014, 11:44 PM) Think i got it. As long as high volume of selling, plus also quite consistent...DESPITE PRICE INCREASING... its distribution You look at the volume and you would usually go  And for a stock like VIS. It's a loss making companay. (another dead giveaway). Thing you will be asking is 'How could a lousy company have such a strong uptrend with consistently high volume'? |
|
|
Apr 28 2014, 11:50 PM
|
|
Senior Member
2,635 posts Joined: Jun 2011 From: bohtakchik |
QUOTE(Boon3 @ Apr 28 2014, 11:47 PM) lambethwalk Yes.. mega difference. Compare a 'normal' strong uptrend stock.... this one is VIS.... Not the difference? This is what i posted just now "Think i got it. As long as high volume of selling, plus also quite consistent...DESPITE PRICE INCREASING... its distribution" ngam? i got it liao  tomorrow print out charts and write in notebook  |
|
|
|
|
|
Apr 28 2014, 11:52 PM
|
|
All Stars
15,942 posts Joined: Jun 2008 |
QUOTE(wankongyew @ Apr 28 2014, 11:45 PM) I'm missing something here. What does distribution mean in this context? Actually nothing much. Just a market observation that several 'bad' looking stocks having huge sell downs today |
|
|
Apr 28 2014, 11:53 PM
|
|
All Stars
15,942 posts Joined: Jun 2008 |
QUOTE(lambethwalk @ Apr 28 2014, 11:50 PM) Yes.. mega difference. Consistent high volume is the biggest dead giveaway that perhaps something is not right with the stock.This is what i posted just now "Think i got it. As long as high volume of selling, plus also quite consistent...DESPITE PRICE INCREASING... its distribution" ngam? i got it liao tomorrow print out charts and write in notebook |
|
|
Apr 28 2014, 11:58 PM
|
|
Senior Member
2,635 posts Joined: Jun 2011 From: bohtakchik |
QUOTE(Boon3 @ Apr 28 2014, 11:50 PM) You look at the volume and you would usually go CRYSTAL CLEAR... And for a stock like VIS. It's a loss making companay. (another dead giveaway). Thing you will be asking is 'How could a lousy company have such a strong uptrend with consistently high volume'? you're the best boon! |
|
|
Apr 29 2014, 12:02 AM
|
|
All Stars
15,942 posts Joined: Jun 2008 |
QUOTE(lambethwalk @ Apr 28 2014, 11:58 PM) CRYSTAL CLEAR... Just watch out for the possibility of some negative spillover sentiments...................  |
|
|
Apr 29 2014, 12:21 AM
|

Senior Member
2,263 posts Joined: Sep 2006 From: i-city |
Graph green mean buy? Red mean sell?
I'm confused with this. Anyone mind to explain? Coz when A buy. There must be B sell In this case consider green or red? Haha |
|
|
Apr 29 2014, 12:33 AM
|
|
Senior Member
8,653 posts Joined: Sep 2005 From: lolyat |
Based on ah boon chart, it is so clearly they keep passing the balls around each other hand, and then *boom*
everything gone with somebody's hand got burned This post has been edited by yhtan: Apr 29 2014, 12:33 AM |
|
|
Apr 29 2014, 08:58 AM
|
|
Senior Member
2,635 posts Joined: Jun 2011 From: bohtakchik |
QUOTE(Boon3 @ Apr 29 2014, 12:02 AM) Just watch out for the possibility of some negative spillover sentiments................... Yesterday loh... spillover sudah.. |
|
|
Apr 29 2014, 09:14 AM
|
|
All Stars
15,942 posts Joined: Jun 2008 |
|
|
Topic ClosedOptions
|
| Change to: |  0.0186sec 0.0186sec
 0.75 0.75
 6 queries 6 queries
 GZIP Disabled GZIP Disabled
Time is now: 19th December 2025 - 08:18 AM |
 Quote
Quote