

 Jun 18 2019, 12:31 PM
QUOTE(turtleundersea @ Jun 18 2019, 12:28 PM)
the term "dividend distribution adjusted", how does it apply to calculation of NAV/performance?
the chart on previous post is mandatory 3 years performance from ifast.
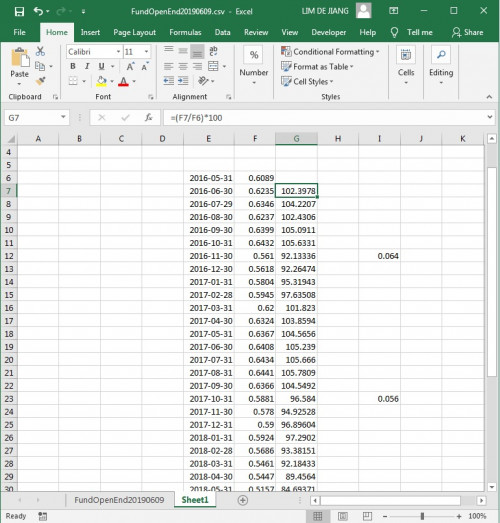
and i have compile the NAV on each date (last working day of every month) and the calculation of each date shown in the current image.
but i cannot get the exact numbers as in the chart.
for example:
2016-06-30 >> 102.29(chart) >> 102.39 (my calculation)
2016-07-29 >> 104.17(chart) >> 104.22 (my calculation)
i was thinking i didnt include the income distribution, but if so, how does the calculation gonna be if include income distribution?

post by yklooi at 2857 did show how to include the distribution....the chart on previous post is mandatory 3 years performance from ifast.
and i have compile the NAV on each date (last working day of every month) and the calculation of each date shown in the current image.
but i cannot get the exact numbers as in the chart.
for example:
2016-06-30 >> 102.29(chart) >> 102.39 (my calculation)
2016-07-29 >> 104.17(chart) >> 104.22 (my calculation)
i was thinking i didnt include the income distribution, but if so, how does the calculation gonna be if include income distribution?
btw,...I think no one (in here) calculates the NAVs movement only....
they calculates the Navs WITH the number of units available at hand
This post has been edited by MUM: Jun 18 2019, 12:34 PM
 Quote
Quote
 OR to promote the use of the other one


 0.0581sec
 0.39
0.39
 7 queries
 GZIP Disabled