

 Oct 3 2012, 08:31 PM

QUOTE(edwin32us @ Oct 2 2012, 08:42 PM)
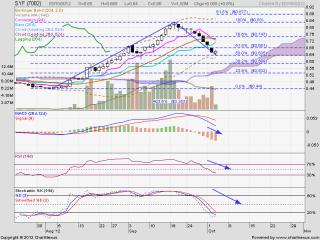
Referring to the Stock Analysis Chart closed on 2nd October 2012
[attachmentid=3079867]
Indicators
1 ) Trendline - Broke above the downtrendline (Bullish)
2) Support/Resistance - formed Higher Low ( Bullish)
3) MACD -Bullish Crossover ( Bullish)
4) RSI - Trending up from 50%( Slightly Bullish)
5) STO - Broke above 80% ( Slightly Bullish)
6) Ichimoku - a) Broke Above support cloud (Bullish).
b) Conversion line below the base line (Bearish).
c) Price above the baseline ( Bullish)
Conclusion:
Bullish -
E ( Entry) : 0.345
S ( Stop Loss) : 0.315
P ( Profit) :0.375
RRR (Risk to Reward Ratio) = 1 (Average)
Next Resistance at 0.355 / 0.365 / 0.38
Support at 0.34 / 0.32 /0.31/ 0.3

Congrats to everybody [attachmentid=3079867]
Indicators
1 ) Trendline - Broke above the downtrendline (Bullish)
2) Support/Resistance - formed Higher Low ( Bullish)
3) MACD -Bullish Crossover ( Bullish)
4) RSI - Trending up from 50%( Slightly Bullish)
5) STO - Broke above 80% ( Slightly Bullish)
6) Ichimoku - a) Broke Above support cloud (Bullish).
b) Conversion line below the base line (Bearish).
c) Price above the baseline ( Bullish)
Conclusion:
Bullish -
E ( Entry) : 0.345
S ( Stop Loss) : 0.315
P ( Profit) :0.375
RRR (Risk to Reward Ratio) = 1 (Average)
Next Resistance at 0.355 / 0.365 / 0.38
Support at 0.34 / 0.32 /0.31/ 0.3

 Quote
Quote


 0.0307sec
 0.61
0.61
 6 queries
 GZIP Disabled