

Deleted
This post has been edited by edwin32us: Sep 21 2012, 01:40 PM
Bursa Traders Thread V1, Coook cooook cooook !
Bursa Traders Thread V1, Coook cooook cooook !
|
|
 Sep 21 2012, 01:38 PM Sep 21 2012, 01:38 PM
Return to original view | Post
#1
|
 
Senior Member
593 posts Joined: Feb 2009 |
Deleted
This post has been edited by edwin32us: Sep 21 2012, 01:40 PM |
|
|
|
|
|
Sep 21 2012, 01:39 PM
Return to original view | Post
#2
|
|
Senior Member
593 posts Joined: Feb 2009 |
QUOTE(Boon3 @ Sep 21 2012, 12:09 PM) Where is the Like button? E ( Entry) : 0.33  Chart for HWGB.  Featured in today's news. Up because of TA and speculation. LOL!   Anyone got any comments to share? http://www.theedgemalaysia.com/business-ne...-analysis-.html » Click to show Spoiler - click again to hide... « DISCLAIMER: » Click to show Spoiler - click again to hide... «  S ( Stop Loss) : 0.3 P ( Profit) :0.375 RRR (Risk to Reward Ratio) = 1.6 (Slightly Rewarding) Next Resistance at 0.32 / 0.335 / 0.355 / 0.38 / 0.395 Support at 0.305 /0.285 / 0.25 |
|
|
Sep 21 2012, 11:27 PM
Return to original view | Post
#3
|
|
Senior Member
593 posts Joined: Feb 2009 |
QUOTE(Boon3 @ Sep 21 2012, 01:47 PM) Back. Suggest to Purchase GLD-C5 and SLV-C3 and hold it until end of the year after GOLD break 1900 hopefully with the QE3.. which i had explained on my blog for your understand This thread is hot!  Where is Chef? Change topic to tune of 'Bursa Traders ..... SkyGor. I understand what you are saying but I guess there are many quarters who are nervous about this QE3 and they would argue QE3 is bad for USD and hence they would want to shift their money to AU and with gold trading at lows of 15xx, it wasn't a suprise to see AU flying. I, personally would not suggest buying AU now. It's late. Buyers are only adopting the chasing game strategy.  source: http://goldprice.org/live-gold-price.html Poh Kong chart again.  With Poh Kong trading at low PE, there will supporters of this stock now.  Added on September 21, 2012, 11:30 pm QUOTE(Boon3 @ Sep 21 2012, 03:45 PM) Congratulations. Bought at a few at 0.335 This post has been edited by edwin32us: Sep 21 2012, 11:30 PM |
|
|
Sep 22 2012, 11:28 AM
Return to original view | Post
#4
|
|
Senior Member
593 posts Joined: Feb 2009 |
HWGB Formed MACD BULLISH CROSSOVER
Investor who have went into this counter i would like to wish you all congratulations and hope you all will profit a lot from the bull today who spotted the buy call on 20 September The Stock LibraryBUY CALL Let check the HWGB Stock Analysis CHart on 21 September 2012 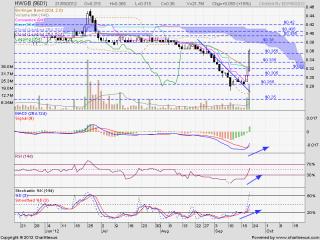
Indicators 1 ) Trendline - Broke above the downtrendline (Bullish) 2) Support/Resistance - formed Lower Low ( Bearish) 3) MACD - Bullish Crossover (Bullish) 4) RSI - Broke above 50%( Bullish) - 5) STO - Bullish Crossover and broke above 50% (Bullish) 6) Ichimoku - a) Below support cloud (Bearish). b) Conversion line below the base line (Bearish). c) Price above the baseline ( Bullish) 7) Volume Distribution - Strong Buying Pressure ( Bullish) 
Conclusion: Bullish E ( Entry) : 0.33 S ( Stop Loss) : 0.3 P ( Profit) :0.375 RRR (Risk to Reward Ratio) = 1.6 (Slightly Rewarding) Next Resistance at / 0.38 / 0.395 Support at 0.32 / 0.335 / 0.355 /0.305 /0.285 / 0.25 |
|
|
Sep 22 2012, 02:03 PM
Return to original view | Post
#5
|
|
Senior Member
593 posts Joined: Feb 2009 |
ASUPREM surge up after break the resistance at 0.35 but retrace back to the support after the bad economic data from China on Thursday.. It is possible to pick up more units for the second bull run..
Let check on ASUPREM stock analysis chart on 21 September 2012 
Indicators 1 ) Trendline - Above the bullish trendline (Bullish) 2) Support/Resistance - formed Lower High (Bearish) 3) MACD -The Bullish Signal Meeting with the Bearish Signal. If Bullish Crossover will confirm the second bullish round 4) RSI - Hovering below 50% and if break above it will confirm the second bullish round 5) STO - Broke above 50% (Bullish) 6) Ichimoku - a) Above support cloud (Bullish). b) Conversion line below the base line (Bearish). c) Price below the baseline ( Bearish) 7) Candlestick - Formed three inside down ( Bearish) . Click here to understand the candlestick 8) Volume Distribution - Buying Pressure is healthy (Bullish) 
Conclusion: Bullish - E ( Entry) : 0.365 S ( Stop Loss) : 0.345 P ( Profit) :0.435 RRR (Risk to Reward Ratio) = 2.6 (Rewarding) Next Resistance at 0.445 Support at 0.35 / 0.31 /0.3/ 0.275 |
|
|
Sep 23 2012, 10:56 AM
Return to original view | Post
#6
|
|
Senior Member
593 posts Joined: Feb 2009 |
QUOTE(john123x @ Sep 22 2012, 04:52 PM) This thread are redundant with the STOCK MARKET DISCUSSION V125 This page is more like for Technical Analysis ( High risk High Reward Play) while the Stock market discussion are for Dividend and Fundamental Analysis Play  |
|
|
|
|
|
Sep 23 2012, 12:14 PM
Return to original view | Post
#7
|
|
Senior Member
593 posts Joined: Feb 2009 |
QUOTE(magika @ Sep 23 2012, 11:13 AM) There is no problem discussing Fa here. Hope to keep an open mind and the more being discussed the better we will be informed. Doesnt matter if we go against the grain, as differences in opinion is much welcome. Haha i did not mention that we cant post FA. Just that majority of the post here at TA with Candlestick charts  Bursa is full of suprises, with manipulators controlling mainstream analyst, up or down is basically their call. while in the Stock market discussion buy call are based on Good Counter based on Dividend Play and FA play |
|
|
Sep 23 2012, 06:22 PM
Return to original view | Post
#8
|
|
Senior Member
593 posts Joined: Feb 2009 |
QUOTE(kueyteowlou @ Sep 23 2012, 02:13 PM) BUY LOW , SELL HIGH = OLD SCHOOL ! BUY HIGH , SELL HIGHER = NEW SCHOOL ! The trend cycle is getting shorter and shorter. Just refer to the semiconductors industries were about 8 years cycle during 1980s, 4 years in 1990s and 2000s. Now is 2010, it has shortened to 2 years. So it is better to play safe within 2 weeks to 2 months holding because we won't know what will happen next . Maybe next it could be Asia crisis like Europe is having now haha. there is no such rule saying that going down will not go down further... the trend could be affect them delist also what... just like US that bank..  We are trader.. we do not look at long long term.. 3-4years are super long for me.. |
|
|
Sep 24 2012, 10:47 AM
Return to original view | Post
#9
|
|
Senior Member
593 posts Joined: Feb 2009 |
JCY broke below the support at 0.835.. Next support 0.795 and 0.75..
Time to buy some JCY-HA ( Profit when it goes down) |
|
|
Sep 24 2012, 03:51 PM
Return to original view | Post
#10
|
|
Senior Member
593 posts Joined: Feb 2009 |
QUOTE(SKY 1809 @ Sep 24 2012, 03:48 PM) KUALA LUMPUR (Sept 24): Futures players made huge gains early today by forcing down the key FBM KLCI by about 28 points or 1.7% to a low of 1595.85, senior dealers told theedgemalaysia.com This post has been edited by edwin32us: Sep 24 2012, 03:54 PMAfter 12 minutes of opening bell, the FBM KLCI plunged by about 28 points to 1595.85 points, with big-cap index linked stocks such as SIME DARBY BHD [] and CIMB Group Holding Bhd falling sharply. The index closed at 1623.70 last Friday. However, the key FM KLCI index has since recouped losses due to buying interest. At noon break, the FBM KLCI ended at 1610.35 points, losing 13.35 points or 0.82% compared to last Friday’s close. In early trade, the FBM KLCI futures fell to a low of 1,589 points before recovering some losses. At noon break, it ended at 1610 points, down by 7.5 points. In response to this market talk, Ang Kok Heng, chief investment officer of Philip Capital Ltd, said: “Somebody short the futures and the FBM KLCI index followed suit. Because the volume was not high, KLCI rebounded when buyers returned.” Many of my friEnds who are in future advice don't play in klse because it is too fragile and easily manipulated if you have 500 million funds. Meaning if george soros want it down it will go down “This sharp plunge has got to do with foreign futures players, as local funds do not play the futures. Moreover, the futures market fell first before the physical market,” he told theedgemalaysia.com. Dealers said the futures players gained by snapping up index futures when the KLCI was at its low of 1,595 points and selling at higher levels when the KLCI rebounded. “By creating volatility and wide gap in the futures and physical markets, the futures players make profit,” one explained. He noted that for Sime Darby, only 1,300 shares were transacted when it was sold down to RM9.62, or a loss of 17 sen per share, in early trade at 9.11 am. About the same time, CIMB Group Holdings Bhd lost 20 sen to RM7.33 per share. “This shows that it cannot be normal investor behaviour,” he said. Both shares have since recouped losses but are still trading at a loss. Ang ruled out the sell-down early today as being linked to normal programme selling on physical market, which happen when foreign funds see valuation of stocks hit their target. The key reason was that the future market fell first before the physical market. “In normal programme selling by funds in the physical market, there is no link with the futures market,” he said. A bank-linked dealer said such activity is normally linked to big funds. He said: “Only big boys play the futures market and can control the market. Once in a while, you see them shorting the futures or doing hedging. The legitimate explanation for today’s sharp fall is linked to futures sell-down to make profit.” |
|
|
Sep 24 2012, 08:34 PM
Return to original view | Post
#11
|
|
Senior Member
593 posts Joined: Feb 2009 |

Check this out fellow investor. Possible of Bullish Pennant but if bearish sentiments still continue high possible it might failed. Just monitor and have a look.. Break up above - 2.66 with high volume ( 8K Lots)- Target Profit at 3.13 ( 18%)  Break below 2.54 with high volume ( 8K Lots) - Target lose at 2.06 ( 18.9%)  Added on September 24, 2012, 8:56 pmJohotin reaches the higher at 2.22 and many investor took profit and retracing to the uptrend line again.. Possible to pick up for another bull run.. Let Check on the Johotin Chart which was closed on Sept 24 2012. Indicators 1 ) Trendline - Broke above Uptrendline ( Bullish) 2) Support/Resistance - Formed higher low and Higher High (Bullish) 3) MACD - Formed bearish crossover (Bearish) . If 4R1G occur potential bullish reversal 4) RSI - Retracing toward 50% ( Bearish) 5) STO - Bearish Crossover and retracing toward 50% ( Bearish) 6) Ichimoku - a) Price above support cloud (Bullish). b) Conversion line above the base line (Bullish). c) Price above the baseline ( Bullish) 7) Candlestick Pattern : Formed bullish engulfing above a hammer ( Bullish) This post has been edited by edwin32us: Sep 24 2012, 08:56 PM |
|
|
Sep 24 2012, 09:16 PM
Return to original view | Post
#12
|
|
Senior Member
593 posts Joined: Feb 2009 |
QUOTE(Boon3 @ Sep 24 2012, 09:05 PM) Edwin, I agree with you that Cocoaland is interesting. Bullish Pennant can go both way.. Just curious. You said 'Break below 2.54 with high volume ( 8K Lots) - Target lose at 2.06 ( 18.9%)'. Why not set a CL at 2.40? If break below , just provide some precaution that it might hit the target which is 18% below. Scary.. Why 2.54 and not 2.4 because pennant plays is about a few cents below the Pennant Line.. Added on September 24, 2012, 9:17 pmJohotin reaches the higher at 2.22 and many investor took profit and retracing to the uptrend line again.. Possible to pick up for another bull run.. Let Check on the Johotin Chart which was closed on Sept 24 2012. ndicators 1 ) Trendline - Broke above Uptrendline ( Bullish) 2) Support/Resistance - Formed higher low and Higher High (Bullish) 3) MACD - Formed bearish crossover (Bearish) . If 4R1G occur potential bullish reversal 4) RSI - Retracing toward 50% ( Bearish) 5) STO - Bearish Crossover and retracing toward 50% ( Bearish) 6) Ichimoku - a) Price above support cloud (Bullish). b) Conversion line above the base line (Bullish). c) Price above the baseline ( Bullish) 7) Candlestick Pattern : Formed bullish engulfing above a hammer ( Bullish) Conclusion: Bullish E ( Entry) : 2.06 ( Ensure closed above this price) S ( Stop Loss) : 1.96 P ( Profit) : 2.20 RRR (Risk to Reward Ratio) = 1.4 (Slightly Rewarding) E ( Entry) : 2.06 ( Ensure closed above this price) S ( Stop Loss) : 1.96 P ( Profit) : 2.32 RRR (Risk to Reward Ratio) = 2.6 (Rewarding) Resistance at 2.22 / 2.12 / 2.34 / 2.48 Support at 1.87 / 1.8 / 1.75 This post has been edited by edwin32us: Sep 24 2012, 09:22 PM |
|
|
Sep 25 2012, 07:56 AM
Return to original view | Post
#13
|
|
Senior Member
593 posts Joined: Feb 2009 |
QUOTE(kueyteowlou @ Sep 25 2012, 07:18 AM) I guess CL is quite subjective questions. It is all depend on your risk appetite and how much cash in your bank ! For cocolnd E = 2.68( break above the bullish pennant) s = 2.54 ( break below 1~2% below the bullish pennant) P = 2.8 , 2.85 , 2.9 and 3.1 I doubt it will occur since the global is bearish again.. |
|
|
|
|
|
Sep 26 2012, 11:19 AM
Return to original view | Post
#14
|
|
Senior Member
593 posts Joined: Feb 2009 |
Something wrong with my computer n unifi. Takes ages to open a page.
Please check on amedia and Johotin Johotin - exploding after rebounding from uptrendline Amedia - forming bullish harami or engulfing .. |
|
|
Sep 26 2012, 11:27 AM
Return to original view | Post
#15
|
|
Senior Member
593 posts Joined: Feb 2009 |
QUOTE(Boon3 @ Sep 26 2012, 11:23 AM) I got the same problem with firefox the other day. Tried on firefox an ie. It takes me 2 hours Just to update 1 page of my blog and I gave up.. Are you using firefox also? If you are, my problems cleared when I restarted my computer and firefox. |
|
|
Sep 26 2012, 06:33 PM
Return to original view | Post
#16
|
|
Senior Member
593 posts Joined: Feb 2009 |
QUOTE(Boon3 @ Sep 26 2012, 04:18 PM) Edwin, nice pick on Johotin. Thanks Boon3.. Just following the Technical Analysis..Manage to gain 5% in 1 day.. Hope will reach the TP for this counter and ready to click on the sell button if the Buying Pressure is less than Selling pressure like when it was at 2.22 Last time when at 2.22 Buy 2.22 30 2.21 10 2.2 50 2.19 30 Sell 2.23 300 ( When selling pressure is more than buying pressure.. Risk to go there is there).. 2.24 500 2.25 600 QUOTE(SKY 1809 @ Sep 26 2012, 04:25 PM) Amedia n Johotin damn powerful ....... Johotin - Good Rebound hope will reach the TPAmedia - Bullish Candle Stick- Bullish Harami.. If tomorrow another white candle.. Can sit and watch the movie for more profit.. |
|
|
Sep 26 2012, 07:45 PM
Return to original view | Post
#17
|
|
Senior Member
593 posts Joined: Feb 2009 |
QUOTE(Boon3 @ Sep 26 2012, 07:28 PM) yhtan: continue.. Agreed. Just put a trailing stop...One option is to set your quit price higher, in order to preserve your great profits. You could either assign a price level, for example if Amedia drops below 95 sen, you quit your position immediately and as Amedia moves higher, move this price level higher to say 98 sen or 1.00 etc etc... Another way is you could use a percentage + price level to determine your quit price. Have your quit price set at 95 sen and include a 'if Amedia drops more than 6% in one single trading session', you call it quits. And if the quit trigger is not triggered, just ride Amedia for as long as possible... Added on September 26, 2012, 7:46 pm QUOTE(Boon3 @ Sep 26 2012, 07:28 PM) yhtan: continue.. Agreed. Just put a trailing stop...One option is to set your quit price higher, in order to preserve your great profits. You could either assign a price level, for example if Amedia drops below 95 sen, you quit your position immediately and as Amedia moves higher, move this price level higher to say 98 sen or 1.00 etc etc... Another way is you could use a percentage + price level to determine your quit price. Have your quit price set at 95 sen and include a 'if Amedia drops more than 6% in one single trading session', you call it quits. And if the quit trigger is not triggered, just ride Amedia for as long as possible... This post has been edited by edwin32us: Sep 26 2012, 07:46 PM |
|
|
Sep 26 2012, 07:48 PM
Return to original view | Post
#18
|
|
Senior Member
593 posts Joined: Feb 2009 |
QUOTE(kueyteowlou @ Sep 26 2012, 07:25 PM)  Good TA Player.. hope you can share more TA knowledge with us.. Good TA Player.. hope you can share more TA knowledge with us..In addition and refer back the accuracy by reading the history of the blog.. |
|
|
Sep 26 2012, 09:13 PM
Return to original view | Post
#19
|
|
Senior Member
593 posts Joined: Feb 2009 |
New Major Project to be analyzed.
The GLOVE SECTOR!! Interesting News on the SAR virus.. This could be a booster for Glove Sectors Health Officials Investigate New SARS-like Virus Detected in Second Person A new virus.. similar to the deadly SARS virus.. has been identified in a patient who is critically ill in a London hospital. Read more... Let check on the Glove Index Sector for 26 September 2012 
Indicators 1) Trendline - Broken above uptrend line at 21.28 ( Bullish ) . 2) Support/Resistance - Formed Lower low and lower high (Bearish) 3) MACD - Bullish Signal Meeting with the Bearish Signal. If bullish crossover will indicate bullish strength. 4) RSI - Broke above 30% and heading towards 50% (Bullish ) 5) STO - Bullish Crossover and broke above 20% (Bullish ) 6) Ichimoku - a) Price in the support cloud and rebound after hitting the bottom of the support cloud.. ( Bullish ). b) Conversion line below the base line (Bearish). c) Price close below the baseline ( Bearish) . 7) Candlestick pattern - Formed 2 white candle after a support hammer (Bullish) . N |
|
|
Sep 26 2012, 11:16 PM
Return to original view | Post
#20
|
|
Senior Member
593 posts Joined: Feb 2009 |
QUOTE(kueyteowlou @ Sep 26 2012, 10:58 PM) that doesn't looks like a hammer.. Hammer should be lower tail long x2 than body.. This is a custom index which sum up with all the glove counter.. For Custom Index , it is very hard to find a nice pattern like a nice hammer without the head.. ( Some ppl called it a weak hammer or spinning top) MACD and Stochastic show positive.. anyway what stock is that? lol how come my chartnexus no GLOVE this stock 1? for that particular day on 24/9 Open 21.47 , Closed at 21.355 = Body Size is 0.115 Lowest at 21.095 ( Tail is = 0.26) - Calculation vice more than 2x |
|
Topic ClosedOptions
|
| Change to: |  0.0504sec 0.0504sec
 0.22 0.22
 7 queries 7 queries
 GZIP Disabled GZIP Disabled
Time is now: 2nd December 2025 - 04:40 AM |
 Quote
Quote