

QUOTE(edwin32us @ Oct 3 2012, 08:31 PM)
Congrats to everybody 

REDTONETook 50% Profit at 0.375
50% waiting for next resistance.. 0.385
Bursa Traders Thread V1, Coook cooook cooook !
|
|
 Oct 4 2012, 09:09 AM Oct 4 2012, 09:09 AM
Return to original view | Post
#41
|
 
Senior Member
593 posts Joined: Feb 2009 |
QUOTE(edwin32us @ Oct 3 2012, 08:31 PM) Congrats to everybody REDTONETook 50% Profit at 0.375 50% waiting for next resistance.. 0.385 |
|
|
|
|
|
Oct 4 2012, 03:30 PM
Return to original view | Post
#42
|
|
Senior Member
593 posts Joined: Feb 2009 |
QUOTE(Kazaff @ Oct 4 2012, 03:18 PM) MBF -wa n Syf start moving again any 1 buying? Going in during 4.40pm and hope it does not go up too much..E ( Entry) : 0.67 ( Closed at or above it) S ( Stop Loss) : 0.62 P ( Profit) :0.735 RRR (Risk to Reward Ratio) = 1.3 (Average) E ( Entry) : 0.67 ( Closed at or above it) S ( Stop Loss) : 0.62 P ( Profit) :0.82 RRR (Risk to Reward Ratio) = 3(Rewarding) E ( Entry) : 0.67 ( Closed at or above it) S ( Stop Loss) : 0.62 P ( Profit) :0.86 RRR (Risk to Reward Ratio) = 3.8 (HIghly Rewarding) |
|
|
Oct 4 2012, 05:38 PM
Return to original view | Post
#43
|
|
Senior Member
593 posts Joined: Feb 2009 |
QUOTE(Boon3 @ Oct 4 2012, 03:42 PM) Kazaff: Edwin posted that last night. Just lucky only .. Some of the forummers at my blog as me, then I Check it out can paste the analysisPost #809. http://forum.lowyat.net/topic/2517998/+800# This again is a good call from Edwin.  Today it forms a higher low which confirm the bullish attack After a weak hammer |
|
|
Oct 4 2012, 09:15 PM
Return to original view | Post
#44
|
|
Senior Member
593 posts Joined: Feb 2009 |
Should we bull on Plantation Sector ?
Written By Edwin Toh on Thursday, 4 October 2012 | 8:35:00 PM There are several reason to bull on plantation sector especially those which are focusing on oil palms 1) Malaysia may reduce palm oil tax . If this succeeds it will greatly increase the profit for the plantation sectors. Check this from Business Times 2) CPO prices is the lowest since year 2008. There might be a correction on the CPO prices and now it is rebounding Let check the Plantation Index Sector 
Indicators 1 ) Trendline - Below the downtrendline (Bearish) 2) Support/Resistance - Formed Lower Low (Bearish) 3) MACD -Formed 4G1R Signal (Bearish) 4) RSI - Inclining and testing 30% (Slightly Bullish ) .If break the 30% it will indicate bullish 5) STO - Inclining and testing 20%(Slightly Bullish ) .If break the 20% and bullish crossover it will indicate bullish 6) Ichimoku - a) Below resistance cloud (Bearish). b) Conversion line below the base line (Bearish). c) Price below the baseline ( Bearish) 7) Candlestick BUllish Harami ( Bullish). Conclusion: Bearish - If break above the downtrendline it will show that is bullish back. This will happen if either one of the condition above meet. Check the Counter Performance for Plantation Counters 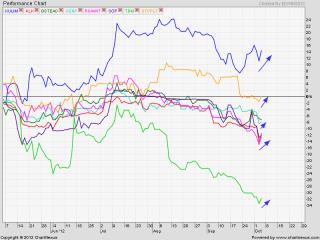
A few laggards counters to monitor 1) TDM 2) RSAWITRSAWIT -- Check This out 3) SOP 4) GENP 5) BSTEAD 6) KLK Leading 1) KULIMCheck this out... 2) UTDPLT This post has been edited by edwin32us: Oct 4 2012, 09:16 PM |
|
|
Oct 5 2012, 08:24 AM
Return to original view | Post
#45
|
|
Senior Member
593 posts Joined: Feb 2009 |
QUOTE(kueyteowlou @ Oct 4 2012, 11:10 PM) nice call edwin ! These are the few stocks which are cheap compare to the Giants like UTDPLT / KLK and Sime Derby. If buy those it will take about few months to achieve the 10% profit..Kulim and RSawit ! hehehe |
|
|
Oct 5 2012, 06:09 PM
Return to original view | Post
#46
|
|
Senior Member
593 posts Joined: Feb 2009 |
QUOTE(kalandra @ Oct 5 2012, 05:03 PM) Guys, can anyone of you guys check for JCY transaction record for me. I think a shark bite 18000 lots @ 0.78 at 4.50pm Today form a super nice long hammerDoes this JCY will goreng again? |
|
|
|
|
|
Oct 6 2012, 03:54 PM
Return to original view | Post
#47
|
|
Senior Member
593 posts Joined: Feb 2009 |
On October 5 Trading, everybody was enthusiastic when it broke 0.745 resistance during the midday by in a big volume and after at the last minute buying pressure went to minimal from 2k lots to about 300lots which not able to sustain the selling pressure at 0.74. During the last minute at 4.50pm, it went down by 2 pips to 0.73 which i dont know whether the market movers did it on purpose to create a bearish pattern to gain more discount stock from retail investors..
Let analyse the SYF Resource Stock Analysis Chart which was closed on 5 October 2012. 
Indicators 1) Trendline - Broke above the down trendline (Bullish) 2) Support/Resistance - Formed higher low (Bullish) 3) MACD -4R2G (Bullish) 4) RSI - Retracing toward 30% (Bearish) .If white candle there is chances of reversal sign 5) STO - Bullish Crossover and broke above 20% (Bullish). 6) Ichimoku - a) Above support cloud (Bullish). b) Conversion line above the base line (Bullish). c) Price above the baseline ( Bullish) 7) Candlestick - Doji Star Formed. ( Bearish). 8) Volume Distribution - Buying Pressure is strong ( Bullish). 
9 ) Company Performance - Earning Report getting better and better no wonder many investors are eyeing on this counter 
Conclusion: Bullish - According to the pattern on 16 August.. It went up pretty high a day before and pause for a while with high volume and follow with a black candle with low volume ( Profit Taking ) and then went started to go up since 22 August from 0.54 to 0.83.. E ( Entry) : 0.67 ( Closed at or above it) S ( Stop Loss) : 0.62 P ( Profit) :0.735 RRR (Risk to Reward Ratio) = 1.3 (Average) E ( Entry) : 0.67 ( Closed at or above it) S ( Stop Loss) : 0.62 P ( Profit) :0.82 RRR (Risk to Reward Ratio) = 3(Rewarding) E ( Entry) : 0.67 ( Closed at or above it) S ( Stop Loss) : 0.62 P ( Profit) :0.86 RRR (Risk to Reward Ratio) = 3.8 (HIghly Rewarding) Next Resistance at 0.68 / 0.75 / 0.83 / 0.877 Support at 0.635 / 0.615 / 0.59 / 0.53 |
|
|
Oct 8 2012, 02:18 PM
Return to original view | Post
#48
|
|
Senior Member
593 posts Joined: Feb 2009 |
QUOTE(Kazaff @ Oct 8 2012, 12:34 PM) more than ur main income like ur salary per month(c which 1 more higher)will be taxable o ask go drink coffee I think they are not able to tax from stock market because think it at the another side. If we lose 100K, are will able to collect compensation from them.. ... ...but normal u earn from stock market lower than 25k per month ,no 1 will ask u go drink coffee,if higher than 100k , u better careful some1 will find u soon...  i forget where i c ppl discuss this question... They only tax was paid is dividen only |
|
|
Oct 8 2012, 03:20 PM
Return to original view | Post
#49
|
|
Senior Member
593 posts Joined: Feb 2009 |
QUOTE(yhtan @ Oct 8 2012, 02:57 PM) Capital gain no need tax, but if your movement in stock market is frequent, the share trading might treat as business income, therefore it is taxable. For me if i was a full time investors.. If we are making a lot of money from investment and request for tax.. I will try to make some small loses in some years..Normally for small fries like us, no need to bother, unless u earn few hundred thousand and buy car/house with cash. Be mentally prepare for LHDN letter for enquiry if u do not declare tax. P/S : Tax evasion might face jail, this part scare people only. As long u pay the fine, government happy u happy.  By the time they request me to pay.. I will provide a few years statement.. For Example.. First Year - Profit 300K Second Year - Lose 50K Third Year Profit 100K If they pay me back for the 2nd year then only i will pay those tax.. Then will their receipt.. for any losses in the 4th year or so , i can claim back from them haha.. But in Bolehland.. we are always the victim.. |
|
|
Oct 8 2012, 08:48 PM
Return to original view | Post
#50
|
|
Senior Member
593 posts Joined: Feb 2009 |
This counter Scomi has been in the Top 10 Counter more than a week due to IJM buying 20% of their stock . This proof that Scomi Business Profit or Business Concept have been inside the IJM investment radar.
Lets check the Stock Analysis Chart for SCOMI on 8 October 2012. 
Indicators 1 ) Trendline - Above the bullish trendline (Bullish) 2) Support/Resistance - formed higher high and higher low (Bullish) 3) MACD - Formed 4R1G(Bullish) 4) RSI - Incline and testing 70% (Slightly Bullish). If break above 70% it will be bullish 5) STO - Formed Bullish crossover in the overbought zone (Slightly Bullish). 6) Ichimoku - a) Above support cloud (Bullish). b) Conversion line above the base line (Bullish). c) Price above the baseline ( Bullish) 7) Candlestick - Formed a Bullish Engulfing ( Bullish) Conclusion: Bullish E ( Entry) : 0.4( Ensure closed at or above it) S ( Stop Loss) : 0.35 P ( Profit) :0.43 RRR (Risk to Reward Ratio) = 0.6 ( Risky) E ( Entry) : 0.4( Ensure closed at or above it) S ( Stop Loss) : 0.35 P ( Profit) :0.45 RRR (Risk to Reward Ratio) = 1( Average) E ( Entry) : 0.4( Ensure closed at or above it) S ( Stop Loss) : 0.35 P ( Profit) :0.47 RRR (Risk to Reward Ratio) = 0.86 ( Slightly Rewarding) Next Resistance at 0.43/ 0.455 / 0.48 / 0.5 / 0.55 ( Bullish Pennant TP) Support at 0.4/0.35 / 0.32 / 0.3 / 0.28 |
|
|
Oct 8 2012, 08:53 PM
Return to original view | Post
#51
|
|
Senior Member
593 posts Joined: Feb 2009 |
Will SYF Pattern Dream come true.
As mention on the previous post on 5 October that it shows a similiar pattern that after a Doji it will formed a black candle with low volume ( PROFIT TAKING) . Tommorow there might a chance to go up a big white candle.. 
Indicators 1) Trendline - Broke above the down trendline (Bullish) 2) Support/Resistance - Formed higher low (Bullish) 3) MACD -4R3G (Bullish) 4) RSI - Retracing toward 30% (Bearish) .If white candle there is chances of reversal sign 5) STO - Bullish Crossover and broke above 20% (Bullish). 6) Ichimoku - a) Above support cloud (Bullish). b) Conversion line below the base line (Bearish). c) Price above the baseline ( Bullish) 7) Candlestick - Doji Star Formed with a black candle. ( Bearish). 8) Volume Distribution - Small Selling Pressure is stronger ( Bearish). 
9 ) Company Performance - Earning Report getting better and better no wonder many investors are eyeing on this counter Conclusion: Bullish - According to the pattern on 16 August.. It went up pretty high a day before and pause for a while with high volume and follow with a black candle with low volume ( Profit Taking ) and then went started to go up since 22 August from 0.54 to 0.83.. Previous Call on 3 October E ( Entry) : 0.67 ( Closed at or above it) S ( Stop Loss) : 0.62 P ( Profit) :0.735 RRR (Risk to Reward Ratio) = 1.3 (Average) E ( Entry) : 0.67 ( Closed at or above it) S ( Stop Loss) : 0.62 P ( Profit) :0.82 RRR (Risk to Reward Ratio) = 3(Rewarding) E ( Entry) : 0.67 ( Closed at or above it) S ( Stop Loss) : 0.62 P ( Profit) :0.86 RRR (Risk to Reward Ratio) = 3.8 (HIghly Rewarding) Buy Call for 9 October E ( Entry) : 0.755 ( Closed at or above it) S ( Stop Loss) : 0.67 P ( Profit) :0.82 RRR (Risk to Reward Ratio) = 1 (Average) For more risk n higher reward E ( Entry) : 0.72 ( Closed at or above it) S ( Stop Loss) : 0.67 P ( Profit) :0.82 RRR (Risk to Reward Ratio) = 2 (Good ) Next Resistance at 0.68 / 0.75 / 0.83 / 0.877 Support at 0.635 / 0.615 / 0.59 / 0.53 |
|
|
Oct 9 2012, 06:28 PM
Return to original view | Post
#52
|
|
Senior Member
593 posts Joined: Feb 2009 |
QUOTE(Boon3 @ Oct 9 2012, 02:57 PM) Edwin: Well done again on Scomi! Thanks hope get winning streak like you all  |
|
|
Oct 15 2012, 07:33 PM
Return to original view | Post
#53
|
|
Senior Member
593 posts Joined: Feb 2009 |
Kulim[COLOR=blue][SIZE=7] almost at the entry price for big bull
Thanks to the CPO tax Cut, most of the plantation counters fair much better 
Indicators 1 ) Trendline - Broke back above the uptrendline the (Bullish ) 2) Support/Resistance - Formed higher Low (Bullish ). If break above 5.03 will formed a higher high which will indicate further stronger bullish attack 3) MACD - Positive Region and Bull signal above the bearish signal (Bullish ) 4) RSI - Rebound from 50% and inclining (Bullish ) .If break the 70% it will indicate more bullish 5) STO - Broke above 80% and formed bullish crossover (Bullish ) 6) Ichimoku - a) Below resistance cloud (Bearish). If break above it will indicate stronger bullish b) Conversion line above the base line (Bullish). c) Price above the baseline ( Bullish) 7) Candlestick BUllish Engulfing( Bullish). Conclusion: Bullish - If remain above the uptrend line Previous buy call on 4 October Entry Price at 5.05 Stop Loss at 4.7 Take Profit at 5.37 Risk to Reward Ration ( RRR) = 0.94 (Slightly Below Average) |
|
|
|
|
|
Oct 26 2012, 09:33 AM
Return to original view | Post
#54
|
|
Senior Member
593 posts Joined: Feb 2009 |
Another potential bull for Redtone..

Indicators 1 ) Trendline - above the Uptrend (Bullish) 2) Support/Resistance - formed Higher Low at 0.36 ( Bullish) 3) MACD -4R1G signal ( Bullish) 4) RSI - Trending up from 50%( Slightly Bullish) 5) STO - If rebound from 20% and with a bullish crossover at 1~2 days after MACD 4R1G signal will provide more bullish confirmation 6) Ichimoku - a) Broke Above support cloud (Bullish). b) Conversion line above the base line (Bullish). c) Price above the baseline ( Bullish) Conclusion: Bullish - E ( Entry) : 0.395 S ( Stop Loss) : 0.35 P ( Profit) :0.405 RRR (Risk to Reward Ratio) =0.37 (Risky) E ( Entry) : 0.395 S ( Stop Loss) : 0.35 P ( Profit) :0.425 RRR (Risk to Reward Ratio) = 0.75 (Slightly Risky) E ( Entry) : 0.395 S ( Stop Loss) : 0.35 P ( Profit) :0.44 RRR (Risk to Reward Ratio) = 1.12 (Average) |
|
|
Nov 2 2012, 07:46 AM
Return to original view | Post
#55
|
|
Senior Member
593 posts Joined: Feb 2009 |
Perisai
E ( Entry) :1.08 ( Closed at or above it) S ( Stop Loss) : 1.04 P ( Profit) :1.11 RRR (Risk to Reward Ratio) = 0.75 (RISKY) E ( Entry) :1.08 ( Closed at or above it) S ( Stop Loss) : 1.04 P ( Profit) :1.13 RRR (Risk to Reward Ratio) = 1.25 (Average) E ( Entry) :1.08 ( Closed at or above it) S ( Stop Loss) : 1.04 P ( Profit) :1.18 RRR (Risk to Reward Ratio) = 2.5 (Rewarding) Resistance 1.11/ 1.15 / 1.16/ 1.2 / 1.23 / 1.25 Support 1.06 / 1.02 / 0.995 / 0.97 / 0.93 |
|
|
Nov 3 2012, 10:57 PM
Return to original view | Post
#56
|
|
Senior Member
593 posts Joined: Feb 2009 |
KUCHAI Formed Higher Low with MACD 4R2G
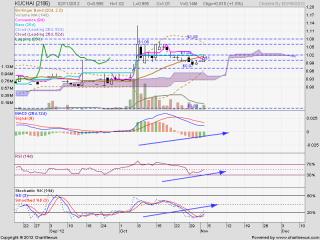
Bullish - E ( Entry) :1.03( Closed at or above it) S ( Stop Loss) : 1.01 P ( Profit) :1.05 RRR (Risk to Reward Ratio) =1 (Average) E ( Entry) :1.03( Closed at or above it) S ( Stop Loss) : 1.01 P ( Profit) :1.07 RRR (Risk to Reward Ratio) =2 (Rewarding) JCY testing the resistance at 0.795 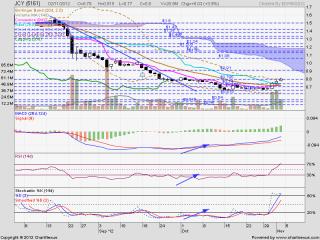
Bullish - E ( Entry) :0.81( Closed at or above it) S ( Stop Loss) : 0.77 P ( Profit) :0.89 RRR (Risk to Reward Ratio) =2 (Rewarding) Resistance at 0.82 / 0.91 / 1.01/ 1.06 Support at 0.74 / 0.7 / 0.65 / 0.615 ALAM - Shooting Star with high volume occurred.. 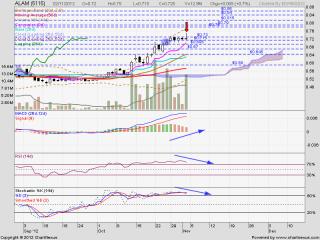
|
|
|
Nov 5 2012, 08:36 PM
Return to original view | Post
#57
|
|
Senior Member
593 posts Joined: Feb 2009 |
KLSE

Indicators 1 ) Trendline - Broke below the uptrend line .. ( Bearish ) 2) Support/Resistance - Formed higher high ( Bullish ) 3) MACD -Bearish Crossover with MACD 4G4R ( Bearish ) . Awaiting for 4R1G signal 4) RSI - Marginally Broken below 50% (Slightly Bearish) , If break below at 50% will indicate further bearish 5) STO - Broke below 50% and bearish crossover (Bearish) 6) Ichimoku - a) Price coming above from the support cloud (Bullish ) b) Conversion line above the base line (Bullish). c) Price close below the baseline ( Bearish) . 7) Candlestick pattern - Formed a weak hammer on the support at 1649 ( Bearish) Conclusion: Bearish .. The is chances that it will formed higher low at 1649 and rebound higher . If tomorrow rebound with white candle , RSI - Indicate rebound above 50% MACD - 4R1G signal Resistance- 1668 /1681 /1725 Support - 1649 / 1621 / 1600 SYF 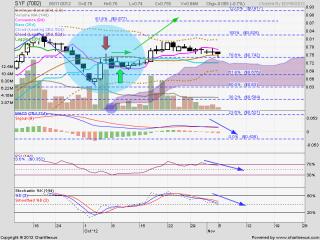
Bullish - E ( Entry) : 0.77 ( Ensure closed above this price) S ( Stop Loss) : 0.73 P ( Profit) : 0.81 RRR (Risk to Reward Ratio) = 1. (Average) E ( Entry) : 0.77 ( Ensure closed above this price) S ( Stop Loss) : 0.73 P ( Profit) : 0.86 RRR (Risk to Reward Ratio) = 2.25 (Slightly Rewarding) Resistance at 0.8 / 0.825 / 0.875 / 0.915 Support at 0.74 / 0.69 / 0.64 GPACKET 
Conclusion: Bullish - E ( Entry) : 0.61 ( Ensure closed above this price) S ( Stop Loss) : 0.56 P ( Profit) : 0.67 RRR (Risk to Reward Ratio) = 1.2 (Slightly Rewarding) E ( Entry) : 0.61 ( Ensure closed above this price) S ( Stop Loss) : 0.57 P ( Profit) : 0.69 RRR (Risk to Reward Ratio) = 1.6 (Slightly Rewarding) E ( Entry) : 0.61 ( Ensure closed above this price) S ( Stop Loss) : 0.57 P ( Profit) : 0.725 RRR (Risk to Reward Ratio) = 2.3 (Rewarding) |
|
|
Nov 7 2012, 08:43 AM
Return to original view | Post
#58
|
|
Senior Member
593 posts Joined: Feb 2009 |
Amedia
RISKY BUY BUT BIG GAIN.. E ( Entry) : 0.42 S ( Stop Loss) : 0.36 P ( Profit) : 0.455 RRR (Risk to Reward Ratio) = 0.58 (Risky) E ( Entry) : 0.42 S ( Stop Loss) : 0.36 P ( Profit) : 0.5 RRR (Risk to Reward Ratio) = 1.33 (Average) Slow and Steady Buy Call E ( Entry) : 0.47 ( Ensure closed above this price) S ( Stop Loss) : 0.40 P ( Profit) : 0.59 RRR (Risk to Reward Ratio) = 1.71 (Slightly Rewarding) |
|
|
Nov 7 2012, 10:46 PM
Return to original view | Post
#59
|
|
Senior Member
593 posts Joined: Feb 2009 |
QUOTE(PhilHellmuth @ Nov 7 2012, 02:09 PM) can someone explain this a little more? Lazy to explain.. can always click at my homepage for details.. at my signature.. |
|
|
Nov 7 2012, 10:47 PM
Return to original view | Post
#60
|
|
Senior Member
593 posts Joined: Feb 2009 |
Alam formed a bullish harami after matching low.

Bullish - E ( Entry) :0.74 ( Closed at or above it) S ( Stop Loss) : 0.715 P ( Profit) :0.77 RRR (Risk to Reward Ratio) = 0.83 (RISKY) |
|
Topic ClosedOptions
|
| Change to: |  0.0570sec 0.0570sec
 0.57 0.57
 7 queries 7 queries
 GZIP Disabled GZIP Disabled
Time is now: 3rd December 2025 - 04:43 PM |
 Quote
Quote