

 Mar 30 2009, 10:09 AM

QUOTE(bulkbiz @ Mar 30 2009, 09:27 AM)
cool. Mind to share your analysis here?

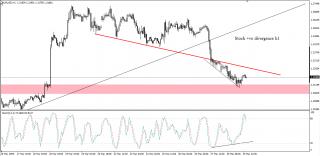
I was using a 15m chart, I guess it's going down when I saw 2 bear candles in succession around the top Bollinger, followed by a parabolic SAR swap from bottom to top, and finally a confirmation from a downward signal at the roof of RSI. I sold a contract and put a limit at the lower Bollinger because I was dressing up and I didn't have time to watch it closely.I didn't screenshot this one so I guess I'll try to start posting up screenshots of my profits and losses to share my analysis.
 Quote
Quote


 0.0276sec
 0.46
0.46
 6 queries
 GZIP Disabled