Let me share my recent postings on Maybank, which was an example of back data testing on 'investment thoeries'...
One of the theory, which I am very sure of, is the DIVIDEND MAGIC theory.
I am always not impressed with those promoting theories that on dividends. Hold it many, many years and one should be able to see the wonders of dividends performing its bomoh tricks on your money....
The very simple point is
the share price is never constant.It is traded.
And with share price getting adjusted after it gives out dividend, how good could it get?
Furthermore, once if dividend trend is on a decline, the share price tends to fall too....So how safe is this dividend theory?
I always feel that dividend should never be the main reason one purchase a stock....
would I buy a cow just for the milk?
or should I buy a cow for its milk and its meat?
Back to Maybank....
Based on the current/trailing dividends of 0.64 sen (Maybank dividend is actually INCREASING, ok!!) and a price of 7.67, we are talking of a yield of 8.34%.Now before you fly to your computer and press buy Maybank shares... perhaps you should do a 5 year study and see what kind of return one is looking at, yes?
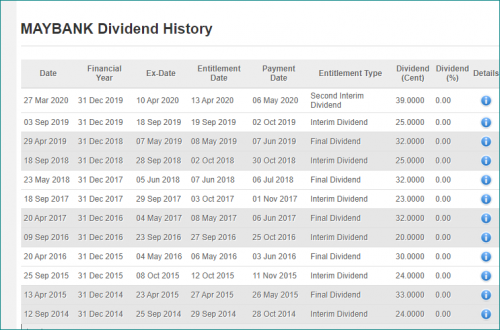
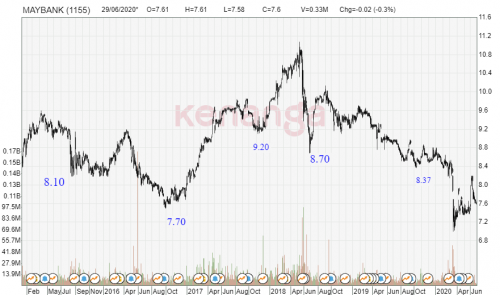
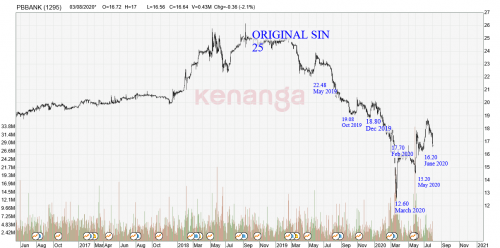
The first chart, I have DISABLED all price adjustments. That is the chart shows the price as it is during a particular time a few years back. On the chart I have written some pricing. Those pricing should be roughly the low of the year. See in this exercise, I gave the benefit of a doubt that the super kampung bomoh dividend raja is able to spot out the best (lowest) price each year to invest in Maybank.
Yes, one call it cheating but for simplicity sake, assume la that ONE CAN BUY MAYBANK AT THE LOWEST PRICE EACH YEAR.The second one is dividend paid out. Screenshot taken from that other website. (I assume it should be accurate). Ok so far?
**** please verify numbers and calculations. I might fark up the numbers.... **
Current price used = 7.67
EXERCISE NO. 1Buy Maybank in 2015 at the lowest possible price and hold until now! Purchase Aug 2015. Price RM8.10
Dividend received since = 0.54 + 0.52 + 0.55 + 0.57 + 0.64 = 2.82
Current price = 7.67
Purchase price = 8.10
*Current holding loss = 0.43 (I despise the phrase paper loss. LOL!)
Total dividend received = 2.82
Total gain since buying = 2.82 - 0.43 = 2.39
CAGR gain for 5 years = 5.31%==========================================================================
EXERCISE NO. 2Purchase Oct 2016. Price 7.70
Dividend received since = 0.32 + 0.55 + 0.57 + 0.64 = 2.08
Current price = 7.67
Purchase price = 7.70
* Current holding loss = 0.03
Total dividend received = 2.08
Total gain since buying = 2.08 - 0.03 = 2.05
CAGR gain for 4 years = 6.08%==========================================================================
EXERCISE NO. 3Purchase Nov 2017. Price 9.20
Dividend received since = 0.32 + 0.57 + 0.64 = 1.53
Current price = 7.67
Purchase price = 9.20
Oh oh!!!!!
* Current holding loss = 7.67 - 9.20 = 1.53
Total dividend since buying = 1.53
NO Gain/LOSS since buying in 2017 ==========================================================================
EXERCISE NO. 4Purchase June 2018. Price 8.70 *assume price bought is b4 dividend went ex on June 2018*
Dividend received since = 0.32 + 0.57 + 0.64 = 1.53
Current price = 7.67
Purchase price = 8.70
* Current holding loss = 7.67 - 8.70 = 1.03
Total dividend since buying = 0.50
CAGR gain for 2 years = 2.83% ==========================================================================
EXERCISE NO.5Purchase Oct 2019. Price 8.37
Dividend received since = 0.64
Current price = 7.70
Purchase price = 8.37
Current holding loss = 7.67 - 8.37 = 0.67
Total dividend since buying = 0.64
Losing 0.03 since 2019! .......

==========================================================================
Review so far...
This is clearly a not sure win stock.....

Even if win .... the winning is not really impressive, yes?
Remember ... I chose the cheapest price each calendar year to buy.
What if I didn't get the cheapest price?
Wouldn't that have yielded a terrible result?
*****
now what if I roll back and do two more years?
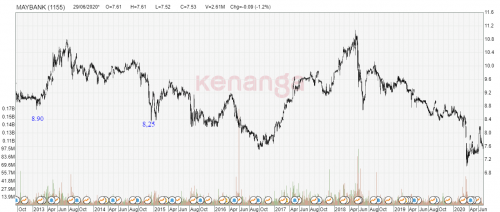 EXERCISE NO. 1Buy Maybank in 2014 at the lowest possible price and hold until now!
Purchase Dec 2014. Price RM8.24
Dividend received since = 0.33 + 0.54 + 0.52 + 0.55 + 0.57 + 0.64 = 3.15
Current price = 7.70.
Purchase price = 8.24
*Current holding loss = 0.54
Total dividend received = 3.15
Total gain since buying = 3.15 - 0.54 = 2.61
CAGR gain for 6 years = 4.68% 
=========================================================================
EXERCISE NO. 2Buy Maybank in 2013 at the lowest possible price and hold until now!Purchase Jan 2013. Price RM8.90
Dividend received since = 0.33 + 0.535 + 0.57 + 0.54 + 0.52 + 0.55 + 0.57 + 0.64 = 4.255
Current price = 7.70.
Purchase price = 8.90
*Current holding loss = 1.20
Total dividend received = 4.255
Total gain since buying = 4.255 - 1.20 = 3.055
CAGR gain for 7 years = 4.30%****************
Conclusion?
And what can we deduce from this exercise?
I cheated and used the year lows as my buying price. I cherry picked my purchase price.
Consider this. In July 2013, Maybank had a high of 10.80!.
If 10.80 was the buying price, the current loss would have been 3.10.
Which would have reduced the total gains to a mere 1.075...
which would mean the CAGR gain for 7 years is only 1.65% !!!
****
How's your investment in Maybank result?
Has it been really magnificent? Super? Average? Below Average?


 Oct 4 2019, 05:01 PM

 Quote
Quote


 0.0272sec
 0.19
0.19
 7 queries
 GZIP Disabled