

huh?? which part are you asking about?
Forex Trading Corner V2
Forex Trading Corner V2
|
|
 May 14 2008, 12:09 AM May 14 2008, 12:09 AM
Return to original view | Post
#201
|
 
Senior Member
1,646 posts Joined: Jun 2007 |
huh?? which part are you asking about?
|
|
|
|
|
|
May 14 2008, 12:41 AM
Return to original view | Post
#202
|
|
Senior Member
1,646 posts Joined: Jun 2007 |
yeah yeah...must learn from losing (i learn from how to lose first
 )...then only can stop losing... )...then only can stop losing...wah...very nice there...200 pips!! grats man...mind to share a bit ar...on how you lost? |
|
|
May 14 2008, 02:06 PM
Return to original view | Post
#203
|
|
Senior Member
1,646 posts Joined: Jun 2007 |
hmm..GJ er..from what i see..it seems that going up will be easier than going down for the time being....
it's in a rather clear sky now..or it might go choppy...Added on May 14, 2008, 7:53 pmwow...GU broke through the support trendline and touched the 100% retracement at the 20/2/08 low at 1.9360. However, it wasnt able to close below the support trendline. let's see if it'll bounce back to 1.9511, this will be the 4th attempt to break 1.9336...- This post has been edited by small-jeff: May 14 2008, 07:53 PM Attached thumbnail(s) 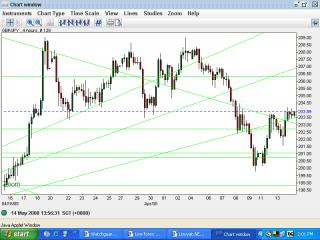
|
|
|
May 16 2008, 02:09 PM
Return to original view | Post
#204
|
|
Senior Member
1,646 posts Joined: Jun 2007 |
hm...looking at EJ (floating on it now..actually
 ..), seems like the 14.6% level is rather a strong one. The extreams are 21/3 low and 23/4 high. Is it trying to form a Head and Shoulder after this bearish flag, or a triangle on the way? ..), seems like the 14.6% level is rather a strong one. The extreams are 21/3 low and 23/4 high. Is it trying to form a Head and Shoulder after this bearish flag, or a triangle on the way?  the 23.6% seems to be a good support as well, at 161.84.. hope it'll break through 163.03 soon... it friday the 23.6% seems to be a good support as well, at 161.84.. hope it'll break through 163.03 soon... it friday Looking at UJ as well...a H/S...GU...the price movement is....ugly why everyone seems so quiet this week? edit: @corez: how different is it for the live FXCM? i would like to use FXCM when i go live as well, but there are something lacking which i dont like... This post has been edited by small-jeff: May 16 2008, 02:15 PM Attached thumbnail(s) 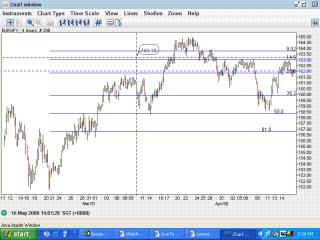
|
|
|
May 16 2008, 03:27 PM
Return to original view | Post
#205
|
|
Senior Member
1,646 posts Joined: Jun 2007 |
ooh...the real one is higher, or the demo?
|
|
|
May 19 2008, 08:28 PM
Return to original view | Post
#206
|
|
Senior Member
1,646 posts Joined: Jun 2007 |
wah...lowyat...thought you quit already...so long didnt see you...i tried to post my results...but too damn long..haha..cannot fit 1 screen..now holding on EJ...stupidly didnt remove position when i sleep
what was the thing you said you learn again? EW? haiya..dont worry..this is LYN..  This post has been edited by small-jeff: May 19 2008, 08:40 PM Attached thumbnail(s) 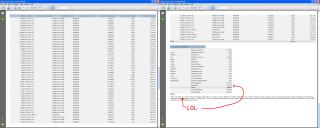
|
|
|
|
|
|
May 19 2008, 09:25 PM
Return to original view | Post
#207
|
|
Senior Member
1,646 posts Joined: Jun 2007 |
haha..smaller spreads...so, easier to scalp..
UJ er..actually its being forced down by a previous congestion zone.. now UJ and EU looks kinda hard...what do you think? Attached thumbnail(s) 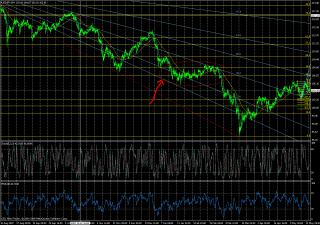
|
|
|
May 19 2008, 10:02 PM
Return to original view | Post
#208
|
|
Senior Member
1,646 posts Joined: Jun 2007 |
hahaha...yeah...especially on GU...move up..move down.. dunno ler.. GJ seems very expensive.. 6-7 pips spread...
hm...GJ also didnt look well last few days..is it forming a rounding top?...what's wrong with most pairs er..? |
|
|
May 19 2008, 11:00 PM
Return to original view | Post
#209
|
|
Senior Member
1,646 posts Joined: Jun 2007 |
hmm...DJIA, NASDAQ, S&P 500 all moved up 0.30%-0.40%...even the USDI moved up 0.19%..
Added on May 19, 2008, 11:05 pmwow...USDI moved up to 0.30% now... This post has been edited by small-jeff: May 19 2008, 11:05 PM |
|
|
May 19 2008, 11:32 PM
Return to original view | Post
#210
|
|
Senior Member
1,646 posts Joined: Jun 2007 |
funny...all the indices are going up...but the prices in forex seems to start to look exhausting...
|
|
|
May 20 2008, 12:27 AM
Return to original view | Post
#211
|
|
Senior Member
1,646 posts Joined: Jun 2007 |
hmm..yeah..i do notice that different brokers do show lag in price movement..and also the variation in SSI...RSI is almost the same. But IMO, as long as the candlesticks are the same, with almost similar OHLC, should be ok..
grats on getting profit on first day!! |
|
|
May 20 2008, 09:31 AM
Return to original view | Post
#212
|
|
Senior Member
1,646 posts Joined: Jun 2007 |
@lowyat:
dont have the charts with me now, but i believe EU will continue to head south.. later go back, then give more details on my 2 cents  hmm..why ar..yesterday i go in chartnexus, but the latest update is to 16/5 only..? |
|
|
May 20 2008, 11:24 AM
Return to original view | Post
#213
|
|
Senior Member
1,646 posts Joined: Jun 2007 |
hm?? just browse, select and submit along with the message..
normeck..how's trading? which pair you on now? |
|
|
|
|
|
May 20 2008, 02:29 PM
Return to original view | Post
#214
|
|
Senior Member
1,646 posts Joined: Jun 2007 |
looking at EJ now...on a daily chart..seems like still in progress of forming right shoulder...but on 1H chart...it looks ugly and bearish..seems like a rounding top, but too wide and long..hope it fails going bearish!
 EU EU...using extreams of 13 Jun 07 low and 23 Apr 08 high, the price is having some rather strong resistance at the 23.6% fanline (bright green). In shorter term, with extreams at 23 Apr 08 high and 08 May 08 low, an attempt to break the 50% level failed, while price closed lower than the 23.6% fanline. Failure to break and close above 1.5563 at the 38.2% retracement level might lead the price to go south again...however, fallowing the bear run last night, seems like it's forming a bear flag, but the formation failed. If the price did manage to break 1.5563, it would probably reach the 50% retracement at 1.5649.. EDIT: is GJ in a big triangle now in the daily chart? This post has been edited by small-jeff: May 20 2008, 02:40 PM Attached thumbnail(s) 
|
|
|
May 20 2008, 02:43 PM
Return to original view | Post
#215
|
|
Senior Member
1,646 posts Joined: Jun 2007 |
ooh..nice...you using SMA HL 39-39?
|
|
|
May 20 2008, 06:39 PM
Return to original view | Post
#216
|
|
Senior Member
1,646 posts Joined: Jun 2007 |
wow...just saw the EU chart...this is madness!! what triggered the bull run anyway? wah..EU can go to 1.5737?
oh..anyone on EJ? done forming the head and shoulder..finally...my EJ can close..haha..next stop...166.xx? grats to both of you guys  |
|
|
May 20 2008, 07:06 PM
Return to original view | Post
#217
|
|
Senior Member
1,646 posts Joined: Jun 2007 |
..nevermind...wait for the correction |
|
|
May 20 2008, 09:28 PM
Return to original view | Post
#218
|
|
Senior Member
1,646 posts Joined: Jun 2007 |
lowyat:
is that a inverse H/S on UJ? |
|
|
May 20 2008, 10:02 PM
Return to original view | Post
#219
|
|
Senior Member
1,646 posts Joined: Jun 2007 |
hm...the major US indices are falling...seems like it can be quite a good indicator after all..
|
|
|
May 21 2008, 12:15 AM
Return to original view | Post
#220
|
|
Senior Member
1,646 posts Joined: Jun 2007 |
i go with USD/EUR/GBP/JPY pairs...cheap cheap all the way ..time frame...1H/4H/Daily/Weekly |
|
Topic ClosedOptions
|
| Change to: |  0.0462sec 0.0462sec
 0.38 0.38
 7 queries 7 queries
 GZIP Disabled GZIP Disabled
Time is now: 8th December 2025 - 09:47 PM |
 Quote
Quote