Welcome Guest ( Log In | Register )

Bump Topic Topic Closed RSS Feed
125 Pages « < 49 50 51 52 53 > » Bottom

Outline · [ Standard ] · Linear+

 Forex Trading Corner V2

views
     
wodenus
post May 10 2008, 08:55 PM

Tree Octopus
********
All Stars
14,990 posts

Joined: Jan 2003
QUOTE(small-jeff @ May 10 2008, 12:46 AM)
hmm...must work harder...2 more days till the market opens again biggrin.gif for the time being, lets learn how to trade forex first..

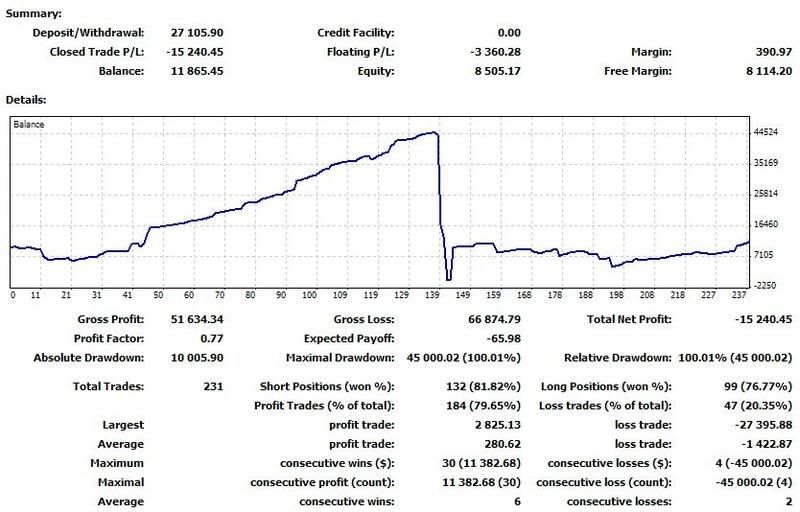
the past 2 weeks not bad...out of 39 positions, lost 3...have to improve...

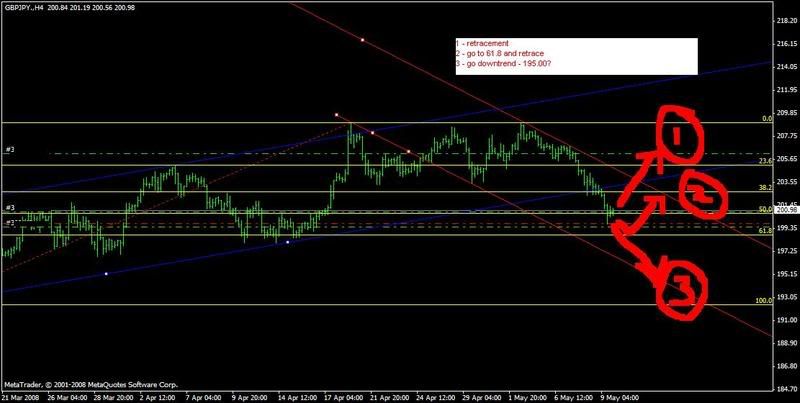
lets have a brief outlook of next week's price direction biggrin.gif
*
Post your results on a blog ! no point saying it here, unless you want to pat yourself on the back smile.gif

This post has been edited by wodenus: May 10 2008, 08:58 PM
normeck
post May 10 2008, 09:07 PM

Look at all my stars!!
*******
Senior Member
3,158 posts

Joined: Dec 2006


user posted image
at last my friend....have been struggle this month...nice pip to everyone!
Happy weekend...!

This post has been edited by normeck: May 10 2008, 09:17 PM
low yat 82
post May 10 2008, 09:47 PM

time is nearing to end
*******
Senior Member
4,081 posts

Joined: Aug 2005


QUOTE(kotarosan @ May 10 2008, 07:43 PM)
how much pips u get daily? how much percent of daily capital increase u earn daily?


Added on May 10, 2008, 7:47 pm

i already expect for that question.

its because i cant afford to look at chart every minutes. i hav to go out too. watching tv, eat, blabla

and i try to to keep at least one position opened since morning i wake up until at night before i go to sleep.

im a scalper. i dont like to waste pips that i know i can chase.
*
daily? lol.. this month been like hell... jus regain bc my confident..

ooo... u noe how to write codes.. cool!!!


100pips per day r... hmm... wont b easy n wont b too hard..depends d chart formation on dat day lor..

yar.. u rite goin full time is better, can watch d chart patern unfold abit by abit.. but as u said... but as u said, lookin at d chart 1 whole day for 5 days a week can b vry.... sweat.gif sweat.gif

@normeck,
hahah... u performance same like mine also tongue.gif lets work for d best !! ganbate!!
wa... wat happen man.. d maximum drawdown so much 1..
normeck
post May 10 2008, 10:16 PM

Look at all my stars!!
*******
Senior Member
3,158 posts

Joined: Dec 2006


that one i don't practice SL...remember last trade? i was hoping for retracement..that time i was never looking for trendline...hmm...

GJ 195...i think..i reach margin call and bankrup...then i went in again..then thats why im asking "feng shui"...i open business in a wrong day..hahhaha!!....

but now..regain it back slowly....

Gj seems down trend ...and bounce back right now...better watch out...

small-jeff
post May 10 2008, 10:17 PM

Regular
******
Senior Member
1,646 posts

Joined: Jun 2007
QUOTE(wodenus @ May 10 2008, 08:55 PM)
Post your results on a blog ! no point saying it here, unless you want to pat yourself on the back smile.gif
*
sweat.gif sweat.gif

then what can i post here? sweat.gif

i was saying that to someone else as i always asked how was his trading sweat.gif


Added on May 10, 2008, 10:18 pm
QUOTE(normeck @ May 10 2008, 10:16 PM)
that one i don't practice SL...remember last trade? i was hoping for retracement..that time i was never looking for trendline...hmm...

GJ 195...i think..i reach margin call and bankrup...then i went in again..then thats why im asking "feng shui"...i open business in a wrong day..hahhaha!!....

but now..regain it back slowly....

Gj seems down trend ...and bounce back right now...better watch out...
*
biggrin.gif

long time no see bro..good to have you back! thumbup.gif

just my little thoughts bout GJ...it might reverse and head towards 203.33

edit: after moving up to 202.27, bounce back down to 201.06, then head up to 203.33...forming last 3 waves of EW...

just my 2 cents

This post has been edited by small-jeff: May 10 2008, 10:37 PM


Attached thumbnail(s)
Attached Image
low yat 82
post May 10 2008, 10:40 PM

time is nearing to end
*******
Senior Member
4,081 posts

Joined: Aug 2005


QUOTE(small-jeff @ May 10 2008, 10:17 PM)
sweat.gif  sweat.gif

then what can i post here?  sweat.gif

i was saying that to someone else as i always asked how was his trading  sweat.gif


Added on May 10, 2008, 10:18 pm

biggrin.gif

long time no see bro..good to have you back!  thumbup.gif

just my little thoughts bout GJ...it might reverse and head towards 203.33

edit: after moving up to 202.27, bounce back down to 201.06, then head up to 203.33...forming last 3 waves of EW...

just my 2 cents
*
wa... dun scare laa... dat was my shortin price leh tongue.gif
small-jeff
post May 10 2008, 10:45 PM

Regular
******
Senior Member
1,646 posts

Joined: Jun 2007
ahhaha...always going opposite with you lar... tongue.gif

maybe you post your chart...discuss what you see...

btw..i'm not trading on GJ.. biggrin.gif
low yat 82
post May 10 2008, 10:56 PM

time is nearing to end
*******
Senior Member
4,081 posts

Joined: Aug 2005


QUOTE(small-jeff @ May 10 2008, 10:45 PM)
ahhaha...always going opposite with you lar... tongue.gif

maybe you post your chart...discuss what you see...

btw..i'm not trading on GJ.. biggrin.gif
*
Attached Image


i dunno wther got rebound or not... but d TP for triple tops still not hit yet.. n also d final few hours not enough to form any pattern, so therefore , i dunno wat to expect on monday... lol
small-jeff
post May 10 2008, 11:05 PM

Regular
******
Senior Member
1,646 posts

Joined: Jun 2007
QUOTE(low yat 82 @ May 10 2008, 10:56 PM)
i dunno wther got rebound or not... but d TP for triple tops still not hit yet..  n also d final few hours not enough to form any pattern, so therefore , i dunno wat to expect on monday... lol
*
ooh...yeah...like that it does look like it's going down...hmmm....
normeck
post May 10 2008, 11:07 PM

Look at all my stars!!
*******
Senior Member
3,158 posts

Joined: Dec 2006


user posted image

i dont know how to draw that line...but this just my 2cents.....

prepare for dropdown till 195.00?..hehehhe!!!

less BUY...more SELL?
low yat 82
post May 10 2008, 11:13 PM

time is nearing to end
*******
Senior Member
4,081 posts

Joined: Aug 2005


waa...... jus spot another bump n run!!! can short again ooo hopefully it will not close above d yellow line for 2 bars.. i use d trendline at d most to d left side... but this bump n run vry difficult to form though... coz it was tradin vry near to d yellow trendline..


Attached Image


Added on May 10, 2008, 11:15 pm
QUOTE(low yat 82 @ May 10 2008, 11:13 PM)
waa...... jus spot another bump n run!!! can short again ooo hopefully it will not close above d yellow line for 2 bars..  i use d trendline at d most to d left side... but this bump n run vry difficult to form though... coz it was tradin vry near to d yellow trendline..
Attached Image
*
d minimum TP is d blue line..

This post has been edited by low yat 82: May 10 2008, 11:15 PM
small-jeff
post May 10 2008, 11:16 PM

Regular
******
Senior Member
1,646 posts

Joined: Jun 2007
lets just hedge... tongue.gif
low yat 82
post May 10 2008, 11:28 PM

time is nearing to end
*******
Senior Member
4,081 posts

Joined: Aug 2005


hmmm... y r d trendline change when i use other TF... hmm.gif hmm.gifAttached Image


Added on May 10, 2008, 11:34 pmanyway, better forget ab this 1... coz d volume does not satisfied d 'handle' of d bump n run.. T.T


Added on May 10, 2008, 11:52 pm
QUOTE
The correct method for tracking the stock market is to use semilogarithmic chart paper, since the market's history is sensibly related only on a percentage basis. The investor is concerned with percentage gain or loss, not the number of points traveled in a market average. For instance, ten points in the DJIA in 1980 meant nothing, a one percent move. In the early 1920s, ten points meant a ten percent move, quite a bit more important. For ease of charting, however, we suggest using semilog scale only for long term plots, where the difference is especially noticeable. Arithmetic scale is quite acceptable for tracking hourly waves since a 300 point rally with the DJIA at 5000 is not much different in percentage terms from a 300 point rally with the DJIA at 6000. Thus, channeling techniques work acceptably well on arithmetic scale with shorter term moves.


hmmm... is this same wit forex also???


This post has been edited by low yat 82: May 10 2008, 11:52 PM
small-jeff
post May 11 2008, 03:25 AM

Regular
******
Senior Member
1,646 posts

Joined: Jun 2007
hmm...are these differences between stock and forex:

In stock (whatever kind it is), if there's a buyer, he/she needs a seller. Similarly, if there's a seller, there must be a buyer as well. Problem arise when one wishes to sell, but there's no buyer, and vice versa. So, the price must be adjusted.

in forex, traders and banks are both buyers and sellers. Banks are sell currencies as well as buying them. Both could make them profits. So, there isnt much problem in the process of trading.

basically, the principle of supply-and-demand is different. Did i get it right?

anyway, lowyat, IMO, if you're trading intraday, there's no need to look at logarithmic charts, unless you're looking at 20 over years of historical charts (though its important) and swings on yearly... IMO only lar biggrin.gif
low yat 82
post May 11 2008, 07:21 AM

time is nearing to end
*******
Senior Member
4,081 posts

Joined: Aug 2005


@small jeff, d key word is liquidity...

fot stock, there r groups or syndicate dat operate d counter.. some, they manipulate demand n supply to attract people to come n buy d share..


Added on May 11, 2008, 10:30 amarrggg.... d concept of EW is easy, 15chapther (44pages), but d dificult part is countin d wave T.T ... i better go get some breakfast...

This post has been edited by low yat 82: May 11 2008, 10:30 AM
small-jeff
post May 11 2008, 01:21 PM

Regular
******
Senior Member
1,646 posts

Joined: Jun 2007
a little on fundamentals...these are the headlights news, that i think might be important to know for next week:

1) Massive Bank Losses And Write Downs Drag Risk Appetite And Carry Lower (Source)

2) US Dollar Consolidates As Oil Tops $126 (Source)

3) Japanese Yen Pairs Primed for Volatility, JPY May Gain Further (Source)

4) US Dollar: US Retail Sales Could Get A Surprise Boost on Tuesday - Why? (Source)

Reports coming out (local time):
13/05/08 12:30AM - GBP Retail Price Index
13/05/08 04:30AM - USD Advance Retail Sales

14/05/08 12:30AM - GBP Jobless Claims Change & ILO Unemployment Rate
14/05/08 04:30AM - USD Consumer Price Index

15/05/08 03:50PM - JPY GDP (1Q P)
low yat 82
post May 11 2008, 06:25 PM

time is nearing to end
*******
Senior Member
4,081 posts

Joined: Aug 2005


EW principle.. key word -> motive waves move in fives, correction waves move in threes
small-jeff
post May 11 2008, 06:36 PM

Regular
******
Senior Member
1,646 posts

Joined: Jun 2007
biggrin.gif
yeah... 1 2 3 4 5 - a b c
what's interesting most is, what'll happen after c... biggrin.gif
low yat 82
post May 11 2008, 09:18 PM

time is nearing to end
*******
Senior Member
4,081 posts

Joined: Aug 2005


QUOTE(small-jeff @ May 11 2008, 06:36 PM)
biggrin.gif
yeah... 1 2 3 4 5 - a b c
what's interesting most is, what'll happen after c... biggrin.gif
*
i guess look at higher degree for clue lor... tongue.gif


anyway, i think wats important is to ride d wave itself... wave 3..hhuhuhuh thumbup.gif thumbup.gif


hmm... IMHO, its like try to spot chart formations.. well, d diffirent is dat, EW will b more difficult since need to examine all d swings.. it will need lots n lots of practice in order to fully 'see it'
small-jeff
post May 11 2008, 09:26 PM

Regular
******
Senior Member
1,646 posts

Joined: Jun 2007
hmm...sometimes it's rather hard to predict whether it'll be a wave 3.. it might eventually turn out to be a channel, unless there's clear R/S far away...usually i only enter position after forming wave 3... biggrin.gif

125 Pages « < 49 50 51 52 53 > » Top
Topic ClosedOptions
 

Change to:
| Lo-Fi Version
0.0236sec    0.60    6 queries    GZIP Disabled
Time is now: 4th December 2025 - 12:57 AM