Oh Kenanga platform and Krono (one of my old winner last time.

)
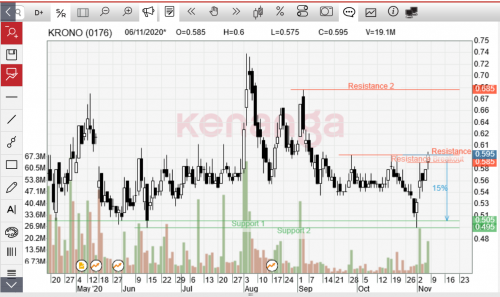
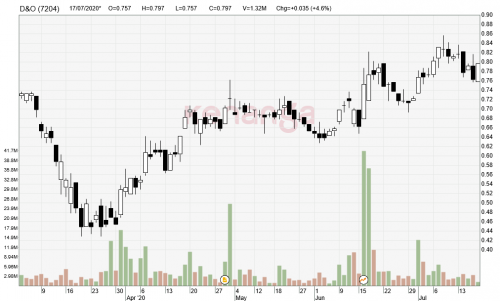
1) The buttons on top of the chart. The camera. It takes a snapshot of what you are looking at. (Fifth from the right)
2) It was on my watching list. The news broke out on the 2nd Nov.
https://www.theedgemarkets.com/article/kron...-contract-chinaIt was around noon (if not mistaken and the edge article came out a couple of hours later)
You can see it on the trade details of the 2nd...
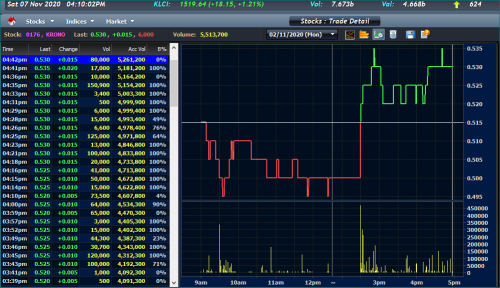
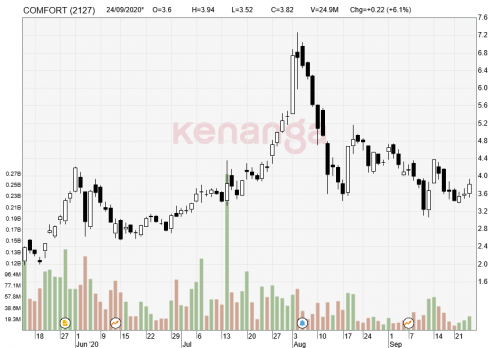
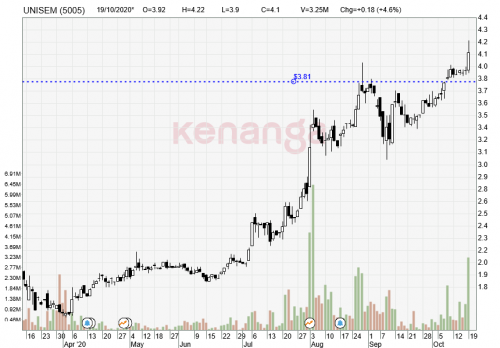
stock was drifting no where.... and then the news came out and pop went Krono (as a matter of fact, it started kicking some butt and pop went the tech leaders such as MPi and Unisem.
3) I will mark down the event on the chart ...
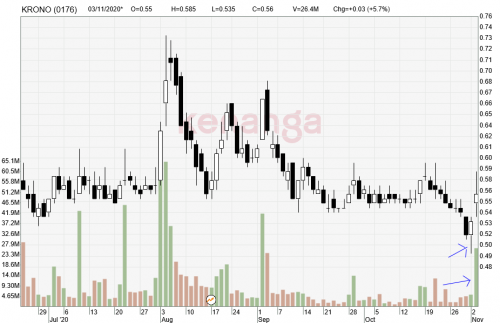
The first arrow showed where how the stock turned around AFTER the news... (from (2) you can see punters/traders hitting up on the stock (reacting on the stock news) between 52 and 53)
4) Oh... notice how I switched off the S/R lines (it's the second button on the top left). Ok, this is my flawed practice. After years of testing, I do not believe in these Support/Resistance lines. Support/Resistance will always be broken. Same perspective with Oversold/Overbought. These things happen. Reacting to these indicators will BADLY effect my trades.
Supports will always be broken.
Today support and tomorrow support will likely not be the same if the stock is in a plunging 'motion'.
Today's support can and will easily turn into tomorrow resistance.
Same with overbought/oversold.
Stocks can be rebound very quickly once it is oversold.
But when shiit happens, stocks can be oversold for a long time.
Buying them assuming they will rebound can badly impact the trade.
Anyway... that's me.
I just don't have and use such stuff.
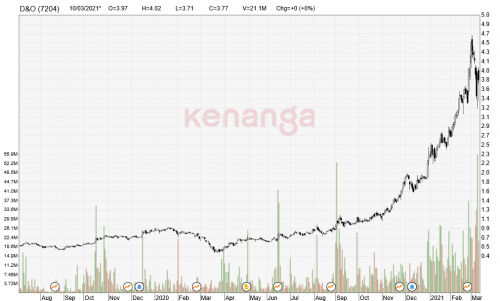
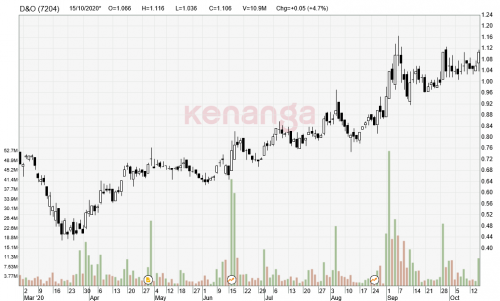
5) It's hard to understand the Krono chart by looking at the 6 month time frame.

So zooming out for another view, it's always useful.
Looking at it the past 1 year ...
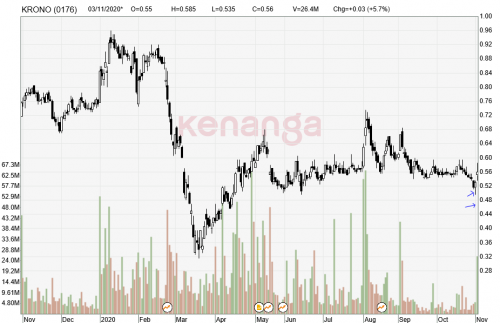
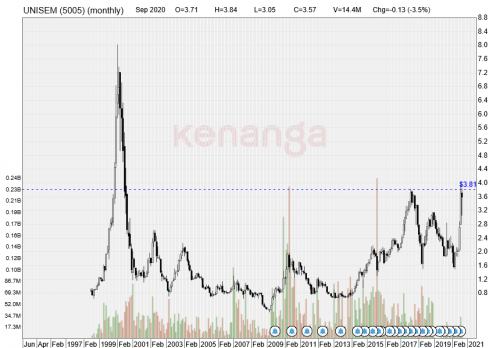
You can see it collapsed.... so need to look back more...
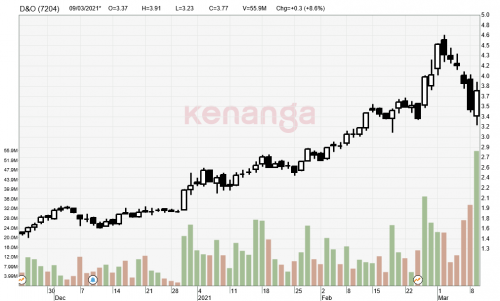
6) The bigger picture

You can also refer to this posting
post #565So the breakout was around Apr 2017.... the earnings although was smallish, it started picking up since then.... and then the stock soared .... it soared past 1.
Since then, since hitting 1 buck .... the stock struggled....
many stale bulls ....
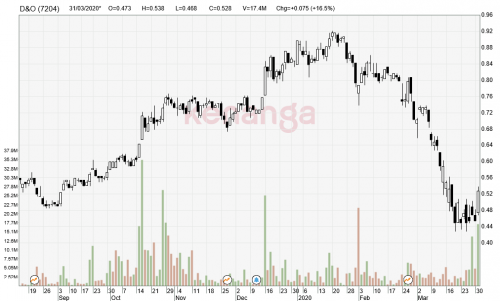
7) So this is where I would say Krono is ....
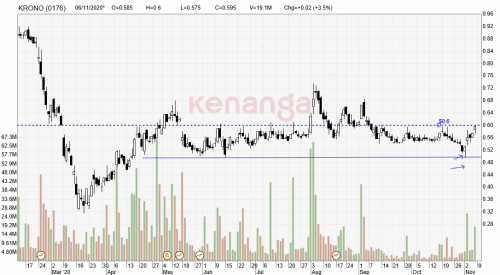
In my opinion (which I could be wrong) , I feel that basically it's stuck in a range... the 50/60 sen range...
(yes, recently the stock did broke out of this range but for me, the stale bulls are firmly in charge... and clearly they disposed on strength ...)
a) So if I want to use breakout strategy ...
I would want to see the return of recent Aug trading volume... I want to see better momentum built up... and I would prefer to see Krono trading above 75 sen...
Yes, I would only consider trading it based on stronger volume and a much higher price.... (this is because I feel there are far too many stale bulls in the stock and because of the stale bull issue, I am skeptical and unsure what kind of running legs Krono possess currently ...

)
b) The low ball strategy would require much patience.... wait for Krono to sink back to the low 50s....
» Click to show Spoiler - click again to hide... «
Kind of extreme...

Such long reply for your simple Q.... LOL!
EDIT: Remember to USE the save button and save whatever markings you made on the chart..... it's a useful practice.


 Jul 13 2020, 01:59 AM

 )
)

 Quote
Quote ) of rm32.00


 I guess if I were to trade Krono, it be difficult to reach the Aug volume now, unless more contracts are awarded and better QR ahead. Personally, I prefer to buy on dips but it is always interesting to learn about technical analysis.
 0.0280sec
 0.35
0.35
 7 queries
 GZIP Disabled