

QUOTE(oOoproz @ Mar 19 2020, 02:18 AM)
Finally broke December 2018, this is unbelievable
S&P500 needs to close below 2300 to increase bearish pressure. After that comes 2000 and 1800.USA Stock Discussion v8, Brexit: What happens now?
|
|
 Mar 19 2020, 03:40 AM Mar 19 2020, 03:40 AM
Return to original view | Post
#81
|
 
Senior Member
4,440 posts Joined: Jan 2010 From: Kuala Lumpur |
QUOTE(oOoproz @ Mar 19 2020, 02:18 AM) Finally broke December 2018, this is unbelievable S&P500 needs to close below 2300 to increase bearish pressure. After that comes 2000 and 1800. |
|
|
|
|
|
Mar 19 2020, 08:20 AM
Return to original view | Post
#82
|
|
Senior Member
4,440 posts Joined: Jan 2010 From: Kuala Lumpur |
QUOTE(cybermaster98 @ Mar 19 2020, 03:40 AM) S&P500 needs to close below 2300 to increase bearish pressure. After that comes 2000 and 1800. So it was a false break below 2300 and a daily close at 2398. This created a bullish pin bar from support on the daily chart of the S&P500 tis morning. Today's close will be crucial. It needs to close above 2500 to form a 'higher high' candlestick and confirm the bullish daily candle. 3 consecutive higher high daily candles and we might have a bottom in place. 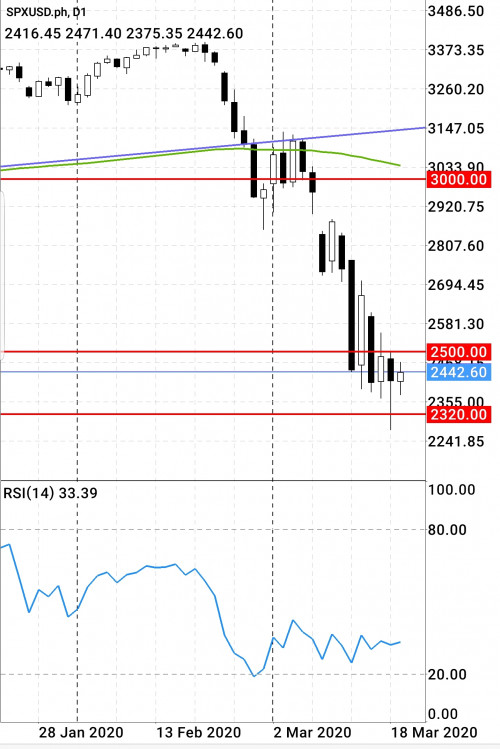 This post has been edited by cybermaster98: Mar 19 2020, 08:38 AM |
|
|
Mar 19 2020, 08:42 AM
Return to original view | Post
#83
|
|
Senior Member
4,440 posts Joined: Jan 2010 From: Kuala Lumpur |
QUOTE(jasontoh @ Mar 19 2020, 08:29 AM) Meaning if the above happen, we can start shopping? 3 consecutive days of higher high daily closes would need to happen tonight, Friday and Monday night which is an incredible feat to achieve. Something like this has never happened since February. So yes that would be my signal to go in. |
|
|
Mar 19 2020, 10:51 AM
Return to original view | Post
#84
|
|
Senior Member
4,440 posts Joined: Jan 2010 From: Kuala Lumpur |
QUOTE(anakMY @ Mar 19 2020, 09:04 AM) Covid hasnt reached the peak yet in US, and the oil price continue tumbling, I dont think US stocks has reach bottom yet right. Of course it hasnt. Im quite sure we will see the S&P500 hitting 2000 or below this month. |
|
|
Mar 20 2020, 08:19 AM
Return to original view | Post
#85
|
|
Senior Member
4,440 posts Joined: Jan 2010 From: Kuala Lumpur |
QUOTE(cybermaster98 @ Mar 19 2020, 08:20 AM) So it was a false break below 2300 and a daily close at 2398. This created a bullish pin bar from support on the daily chart of the S&P500 tis morning. Did not happen. So i think we will see a breach of 2300 soon.Today's close will be crucial. It needs to close above 2500 to form a 'higher high' candlestick and confirm the bullish daily candle. 3 consecutive higher high daily candles and we might have a bottom in place.  |
|
|
Mar 20 2020, 11:26 PM
Return to original view | Post
#86
|
|
Senior Member
4,440 posts Joined: Jan 2010 From: Kuala Lumpur |
Dont buy this bounce. This is not market bottom.
|
|
|
|
|
|
Mar 21 2020, 04:39 AM
Return to original view | Post
#87
|
|
Senior Member
4,440 posts Joined: Jan 2010 From: Kuala Lumpur |
QUOTE(cybermaster98 @ Mar 20 2020, 11:26 PM) Dont buy this bounce. This is not market bottom. S&P500 has officially closed down 4.3% to the lowest level since 9 Feb 2017. The 2,304 close today was below the 2018 low of 2,346. This could result in a further drop to the next key support level of 1,829 the low of 2016.However, if the S&P500 can close back above 2,346 next week it will make today's close a false break and potentially result in a bullish reversal. This post has been edited by cybermaster98: Mar 21 2020, 04:49 AM |
|
|
Mar 23 2020, 09:06 PM
Return to original view | Post
#88
|
|
Senior Member
4,440 posts Joined: Jan 2010 From: Kuala Lumpur |
QUOTE(Raymond_ACCA @ Mar 23 2020, 09:01 PM) Wow, futures was down the whole day until now. Yup. Feds commitment to buy treasuries sent futures up 2.6% |
|
|
Mar 24 2020, 11:15 AM
Return to original view | Post
#89
|
|
Senior Member
4,440 posts Joined: Jan 2010 From: Kuala Lumpur |
This is the S&P500 Daily chart. The past 2 daily candles ended as bearish pin bars indicating rejection at 2400-2500. We need a daily close above 2500 else there wil be further drops ahead.
 |
|
|
Mar 24 2020, 11:53 PM
Return to original view | Post
#90
|
|
Senior Member
4,440 posts Joined: Jan 2010 From: Kuala Lumpur |
S&P500 needs a close above 2,500 first before we can assume a temporary bottom is in place. But this current rebound is a mix of short term traders plus a short covering squeeze. It wont last.
This post has been edited by cybermaster98: Mar 24 2020, 11:54 PM |
|
|
Mar 25 2020, 12:22 AM
Return to original view | Post
#91
|
|
Senior Member
4,440 posts Joined: Jan 2010 From: Kuala Lumpur |
QUOTE(cybermaster98 @ Mar 24 2020, 11:53 PM) S&P500 needs a close above 2,500 first before we can assume a temporary bottom is in place. But this current rebound is a mix of short term traders plus a short covering squeeze. It wont last. First resistance is 2500 followed by 2605. Only a Daily or Weekly close above 2605 will confirm a resumption of the bullish trend. The rebound today is also a well timed technical correction from severely oversold conditions as indicated by the weekly RSI chart. The main driver is still Covid-19 and the economic impact. The US is far from reaching its peak numbers. 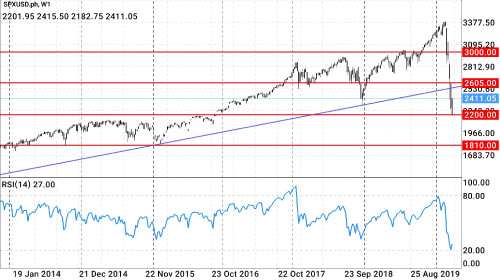 This post has been edited by cybermaster98: Mar 25 2020, 12:27 AM |
|
|
Mar 25 2020, 09:51 PM
Return to original view | Post
#92
|
|
Senior Member
4,440 posts Joined: Jan 2010 From: Kuala Lumpur |
QUOTE(cybermaster98 @ Mar 25 2020, 12:22 AM) First resistance is 2500 followed by 2605. Only a Daily or Weekly close above 2605 will confirm a resumption of the bullish trend. The rebound today is also a well timed technical correction from severely oversold conditions as indicated by the weekly RSI chart. Watch these levelsThe main driver is still Covid-19 and the economic impact. The US is far from reaching its peak numbers. |
|
|
Mar 25 2020, 11:22 PM
Return to original view | Post
#93
|
|
Senior Member
4,440 posts Joined: Jan 2010 From: Kuala Lumpur |
QUOTE(cybermaster98 @ Mar 25 2020, 12:22 AM) First resistance is 2500 followed by 2605. Only a Daily or Weekly close above 2605 will confirm a resumption of the bullish trend. The rebound today is also a well timed technical correction from severely oversold conditions as indicated by the weekly RSI chart. https://www.cnbc.com/2020/03/24/jim-cramer-...ays-bounce.htmlThe main driver is still Covid-19 and the economic impact. The US is far from reaching its peak numbers. |
|
|
|
|
|
Mar 26 2020, 08:45 PM
Return to original view | Post
#94
|
|
Senior Member
4,440 posts Joined: Jan 2010 From: Kuala Lumpur |
QUOTE(bursageek @ Mar 26 2020, 08:36 PM) https://www.nytimes.com/2020/03/26/business...oronavirus.html 3.283mil3 million people filed unemployment claims in the US, following 500k in the UK and 1 million in Canada this week. Unfortunately market will probably gate crash tonight as investors face the grim reality of the health crisis. |
|
|
Mar 26 2020, 10:29 PM
Return to original view | Post
#95
|
|
Senior Member
4,440 posts Joined: Jan 2010 From: Kuala Lumpur |
QUOTE(cybermaster98 @ Mar 25 2020, 12:22 AM) First resistance is 2500 followed by 2605. Only a Daily or Weekly close above 2605 will confirm a resumption of the bullish trend. The rebound today is also a well timed technical correction from severely oversold conditions as indicated by the weekly RSI chart. A Weekly close above 2,605 will confirm:The main driver is still Covid-19 and the economic impact. The US is far from reaching its peak numbers. 1) 3 consecutive 'higher high' bullish Daily candles 2) a close back within the long term bullish uptrend since Oct 2011 3) the break below the long term blue trend line last week was a false break. This usually creates a strong movement in the direction of the reversal Under normal circumstances this would automatically serve to prove that a bottom is firmly in place. But 1 major factor is still missing. The current unknown variable connected to the Covid-19 pandemic where the infection spread in the US has just begun to gather steam and not expected to peak anytime soon. This might prove to be the unseen resistance in the stock market preventing further bullish spikes or even another drop to the lows of 2200. This post has been edited by cybermaster98: Mar 26 2020, 10:30 PM |
|
|
Mar 27 2020, 08:08 AM
Return to original view | Post
#96
|
|
Senior Member
4,440 posts Joined: Jan 2010 From: Kuala Lumpur |
QUOTE(cybermaster98 @ Mar 26 2020, 10:29 PM) A Weekly close above 2,605 will confirm: So we are back on the bull trend. 1) 3 consecutive 'higher high' bullish Daily candles 2) a close back within the long term bullish uptrend since Oct 2011 3) the break below the long term blue trend line last week was a false break. This usually creates a strong movement in the direction of the reversal Under normal circumstances this would automatically serve to prove that a bottom is firmly in place. But 1 major factor is still missing. The current unknown variable connected to the Covid-19 pandemic where the infection spread in the US has just begun to gather steam and not expected to peak anytime soon. This might prove to be the unseen resistance in the stock market preventing further bullish spikes or even another drop to the lows of 2200. Im baffled how the stock market re-entered a bull trend while the infection spread got worse in the US. Highest ever daily increase in new cases. Clearly this was a bullish spike based solely on sentiment. I think its a bull trap and it wont last. https://www.investopedia.com/terms/b/bulltrap.asp This post has been edited by cybermaster98: Mar 27 2020, 08:43 AM |
|
|
Mar 28 2020, 04:19 AM
Return to original view | Post
#97
|
|
Senior Member
4,440 posts Joined: Jan 2010 From: Kuala Lumpur |
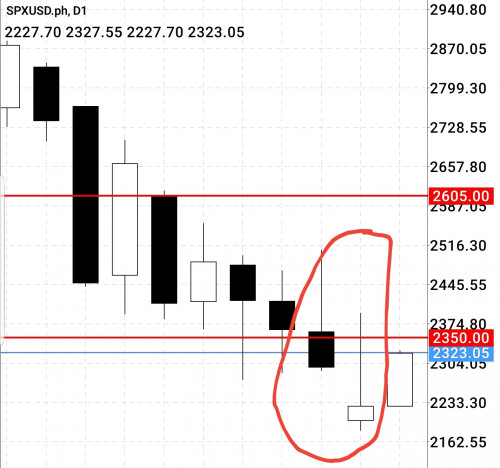
QUOTE(cybermaster98 @ Mar 27 2020, 08:08 AM) So we are back on the bull trend. And yes it didnt last. S&P500 is back in bear market after closing at 2,542 down 3.3% from yesterday's close. That would put it at 25% lower than the yearly high of 3,395. Im baffled how the stock market re-entered a bull trend while the infection spread got worse in the US. Highest ever daily increase in new cases. Clearly this was a bullish spike based solely on sentiment. I think its a bull trap and it wont last. https://www.investopedia.com/terms/b/bulltrap.asp However, it still formed a bullish engulfing weekly candle which could mean further strength next week. A daily close above 2,640 will send market back up while a close below 2,500 would increase the bearish pressure towards testing 2,200 again. 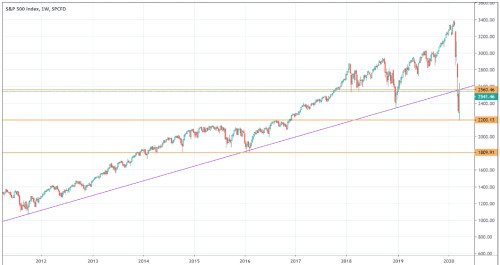 |
|
|
Mar 28 2020, 06:57 PM
Return to original view | Post
#98
|
|
Senior Member
4,440 posts Joined: Jan 2010 From: Kuala Lumpur |
QUOTE(moosset @ Mar 28 2020, 01:14 PM) what about in between 2500 ~ 2640??? Normal range for movement. We need a breakout above and below the stated levels to ensure a bullish or bearish follow through. |
|
|
Apr 2 2020, 12:48 PM
Return to original view | Post
#99
|
|
Senior Member
4,440 posts Joined: Jan 2010 From: Kuala Lumpur |
QUOTE(cybermaster98 @ Mar 28 2020, 04:19 AM) And yes it didnt last. S&P500 is back in bear market after closing at 2,542 down 3.3% from yesterday's close. That would put it at 25% lower than the yearly high of 3,395. Finally got a daily close below 2500 on the S&P500. Now to see if it can hit 2200 or rebound back above 2500. I think there is more bearish pressure ahead.However, it still formed a bullish engulfing weekly candle which could mean further strength next week. A daily close above 2,640 will send market back up while a close below 2,500 would increase the bearish pressure towards testing 2,200 again. |
|
|
Apr 2 2020, 09:37 PM
Return to original view | Post
#100
|
|
Senior Member
4,440 posts Joined: Jan 2010 From: Kuala Lumpur |
Market moving up now
|
| Change to: |  0.4709sec 0.4709sec
 0.58 0.58
 7 queries 7 queries
 GZIP Disabled GZIP Disabled
Time is now: 5th December 2025 - 02:40 PM |
 Quote
Quote