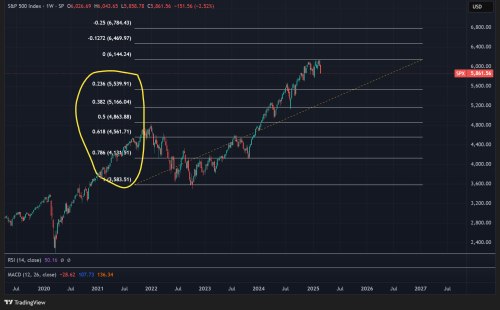
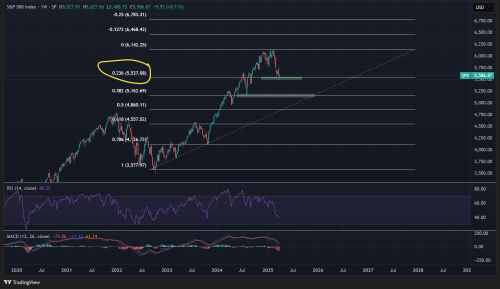
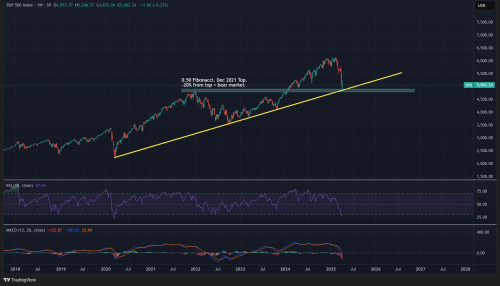
To be honest, it is abit too early to tell which area should be the buy zone. Give it at 6-10 months. But below are the Fibonacci retracement levels. The 0.5 (4863) which is -20%. That is the area I will pay attention if it does come. That level is previous high (January 2022) which can act as very strong support.
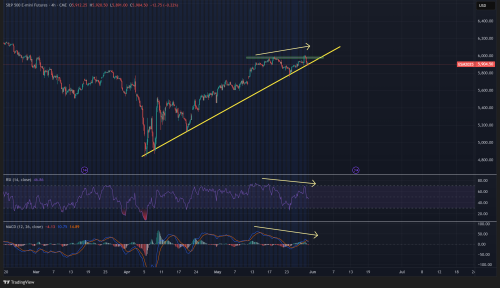
First level retracement 0.236 already reached. If dont hold and break below 5450, more likely to visit next level 0.382...5160.
Look like today possible will plunge the S&P into bearish.
With this sharp drop, will there be V-shaped recovery?
Many past situations show it will.
These might help toward V shape recovery.
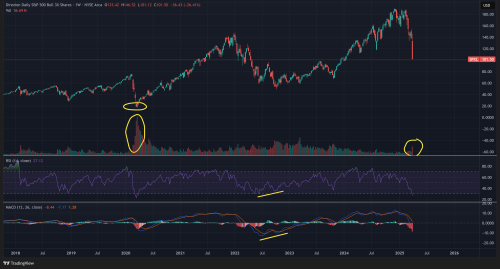
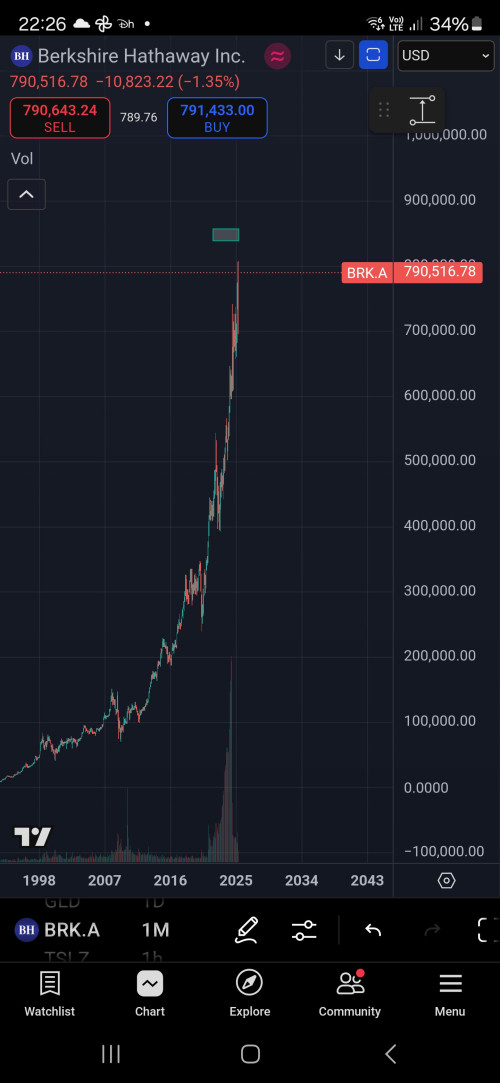
I am currently on SPXU (-3x SP500) since February. So naturally I will look into SPXL(3x SP500) and I found interesting stuffs.
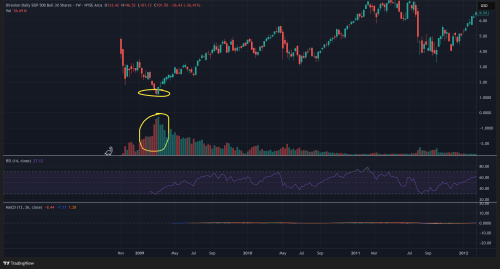
Need to wait for volume to spike like covid crash. If you see volume starting to spike, it mean institution activities is increasing. Wait until you see highest spike(green color) + green engulfing candle, that is your entry.
This is Lehman crash. Same activity. Volume spike(green) + green engulfing candle.
The chart is on weekly basis right, so the weekly volume data is only known one week after the recovery. That means we will always be behind by 1 week?
Yeah I am using tradingview. Yes it is Weekly chart. Now I check the weekly volume candle closed on every Monday (except Monday holiday US market). I am not sure it lag behind 1 day or 1 week. Tonight market open I see how again.
The chart is on weekly basis right, so the weekly volume data is only known one week after the recovery. That means we will always be behind by 1 week?
I just checked. Today tradingview weekly chart. It show a new volume candle. So basically the volume candle closed on Friday US market ( Saturday morning our time).
To make it easier, if saturday morning(our time) see volume green spike + green engulfing candle, by Monday night can buy the dip.
To be honest, it is abit too early to tell which area should be the buy zone. Give it at 6-10 months. But below are the Fibonacci retracement levels. The 0.5 (4863) which is -20%. That is the area I will pay attention if it does come. That level is previous high (January 2022) which can act as very strong support.
I know last night look like huge manipulation on tariff pause fake news. But if dive into technical. SP500 has reach my area of interest(This is way too fast to reach). It bounces from Fibonacci 0.5(4863) and it is -20% from top. In textbook, a -20% from top is bear market territory. So last night it is understandable wall street trying to save it. This level is also bull market trendline since 2020 covid. Very important level to watch.
This post has been edited by mois: Apr 8 2025, 10:41 AM
It is very strange. Suppose to be traders buying bonds when they sell equities but they're selling bonds as well, causing yield to rise. Where are they putting the money? Cash only?
Technically the rebound is well expected - Trump seems to be responding to S&P 5,100 as the floor, as himself and Bessent both tried to prop up the market yesterday.
The reality is far from the optimistic messages they sent yesterday. If the US can't get a deal done quickly with Japan, imagine how long it will take with China. With tariffs remaining an uncertainty for so long, the economy will see increasing pressure - growth slower, inflation building up, consumers reluctant to spend, corporates less willing to invest, etc.
My biggest worry is still the government debt. As the economy slows, deficits will likely go up. Higher deficits coupled with a weaker dollar will make refinancing much more difficult.
A few positive headlines might drive up the market, but none of the underlying forces have been changed.
Yep. The way I see it, positive news leading up to lower high before they initiate short to dump the market to fill their longs. Rinse and repeat. Sadly we aren't inside his whatapps pump and dump group. Charles Schwab made 2.5billion last few week on the pump. Another one made 900 millions. Gods know when they will reload their SPXU and SQQQ.
This post has been edited by mois: Apr 24 2025, 12:52 PM
Been holding the following US ctrs for 2 -3 yrs,... never sold. Latest average prices :- 1) Nvidia : 129.02 2) Tesla : 250.21 3) Apple : 197.00 4) PennantPark : 11.67 (pays out dividend every mth ) 5) Proshares Short BTC ETF : 8.82 (bought last year when BTC ETFs started to get clearance from the Biden Administration).
So,... no profit taken for me,... guessed I'm not a good trader.
Is this referring to SBIT? This week I bought some $7.6. The volume for the past few months are astronomical.
This post has been edited by mois: May 17 2025, 06:04 PM


 Apr 1 2025, 10:06 PM


 Quote
Quote


 0.0785sec
 0.29
0.29
 7 queries
 GZIP Disabled