Common myths about drawing support and resistance levels:Myth 1: You should draw every level you can find on your charts – Many traders fall into this trap, they end up taking an hour to draw on every little level they can find. What they end up with is a really messy chart that basically does more harm than good.
You need to learn to draw only the significant levels on your charts, then you’ll have a useful framework to work from.Myth 2: Your S/R (support and resistance) levels should always be drawn across the exact highs or lows of price bars – This is perhaps the biggest myth that traders have about drawing levels on their charts. Often times, support and resistance are more “zones” than exact “levels”, sometimes you will have a key level that is indeed an exact level, but more often than not we are going to be drawing our support and resistance lines midway through bar tails or even through the body of a bar sometimes.
Point being, you don’t always have to draw the level exactly through the high or low of the bar. Note: if you are totally new and confused by some of the lingo here, please take some time to go over this candlestick tutorial before moving on.
Myth 3: You should go back really far in time with your levels –
Unless you are a long-term buy-and-hold investor right now, you don’t need to go back more than about 8 months when drawing your levels.Stolen from:
http://www.learntotradethemarket.com/forex...sistance-levelsstolen pictures from that link.


.... some will just EFFFFFF me up left, right and center and say my post is a waste of internet space...
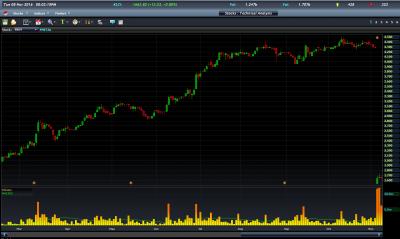
all one needs to do is open the interactive stock chart from the trading platform and the S&R are all readily drawn nice nice for one to see.
for example...

and then....
some don't even use S&Rs......
cos they are a bloody waste of time...
since with the market being fluid, S&Rs fluctuates and changes daily ...
yea... the support and resistance lines are there to be broken....


 Aug 30 2016, 11:33 AM

 Quote
Quote
 thank you very much !


 0.1311sec
 0.74
0.74
 7 queries
 GZIP Disabled