Repeat from last month + made some edition to the posting.

KLCI closing at month end.
Jan: 1627.55
Feb: 1,637.63 - up 10.08
March: 1,671.63 - up 34.00
Apr: 1,717.65 - up 46.02
May: 1,769.22 - up 52
June: 1773.54 - up 4.3
Walaeo eh.... every month also up.

Looks like Pong Sway chart so accurate ah?

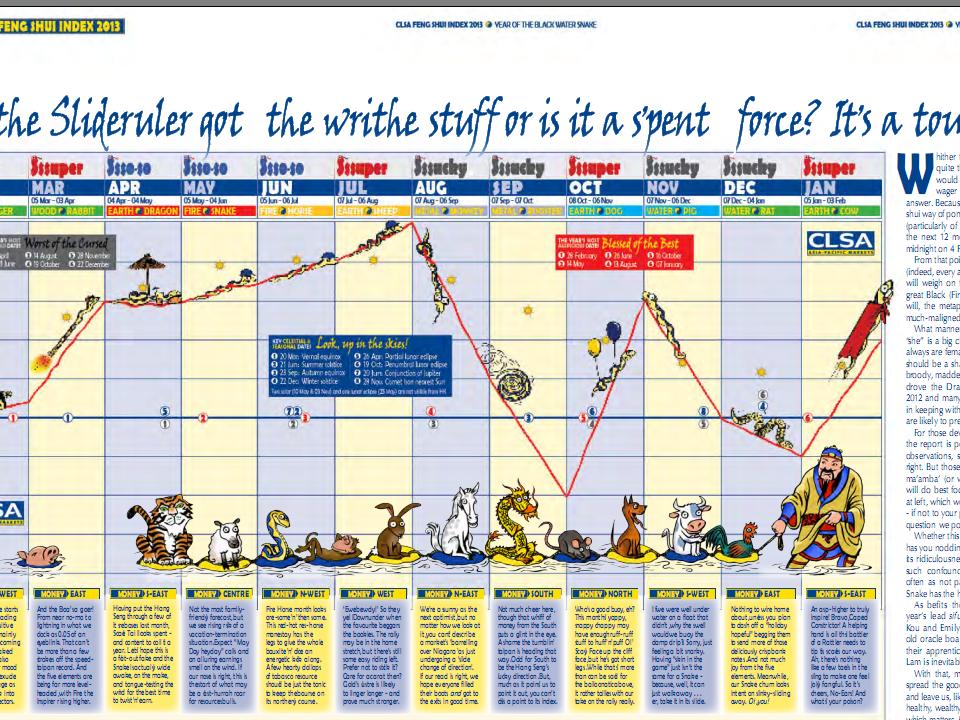
ps: Did Pong Sway warn that for June 2013 we could be down as much as 68.9 pts before recovering?
June high: 1792.67. Low 1723.74
ps: Would a warning that such a big swing be helpful?
ps: Draw up those data on an excel chart? The Excel chart not accurate hor.
ps: End July 2013 coming. SELL! SELL! SELL!
ps: Pong Sway chart for 2012 accurate ah?
ps: Pong Sway chart for 2011 accurate ah?
Anyway like I say "This is like saying it doesn't matter when the Fong Sway chart is wrong. It only matters when it is correct."
Edit: Jan 1627.55. Now 1799.19.
KLSE up 171.64 for the year!

Pong Sway chart says...
By Sept... we would be negative,
Stand by for a drop of more than 171.63 pts.
Where is the nearest high building....
This post has been edited by Boon3: Jul 19 2013, 12:25 PM 

 Jul 19 2013, 12:01 PM


 Quote
Quote


 how about this?

 mana satu, i missed what you said earlier
 0.0183sec
 0.50
0.50
 6 queries
 GZIP Disabled