

Dow Jones Head and Shoulder Pattern Bear executed. Potential drop below 10000 until 9500..
Scary...
http://edwinextremebullrun.blogspot.com/20...er-bearish.html
US stock discussion v4, Bulls-Bears HUAT AH!! Pigs get slaughter
US stock discussion v4, Bulls-Bears HUAT AH!! Pigs get slaughter
|
|
 Sep 26 2011, 02:52 PM Sep 26 2011, 02:52 PM
Return to original view | Post
#1
|
 
Senior Member
593 posts Joined: Feb 2009 |
Dow Jones Head and Shoulder Pattern Bear executed. Potential drop below 10000 until 9500..
Scary... http://edwinextremebullrun.blogspot.com/20...er-bearish.html |
|
|
|
|
|
Sep 17 2012, 11:45 AM
Return to original view | Post
#2
|
|
Senior Member
593 posts Joined: Feb 2009 |
Dow Jones Continue to soar after QE3 was approved. 19/30 Counters in Dow Jones was in positive while the other 11 counters closed negatively.
Let check the Dow Jones Chart which was closed on 14 September for Dow Futures/ Stock Investors 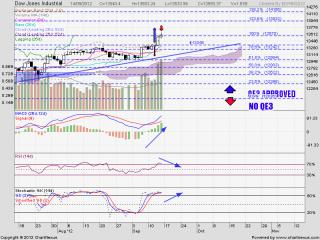
Indicators ( Note using Fibonacci retracement to plot out the new support/ resistance because now it is all time high) 1 ) Trendline - Above the bullish trendline (Bullish) 2) Support/Resistance - formed Higher high and all high( Bullish) 3) MACD - Bullish Crossover and remain green. ( Bullish) . If 4G1R, better watchout for bearish reversal 4) RSI - Broke the 70% overbought resistance ( Bullish) but if observed carefully it is retracing. Watchout if it goes near back to 70% because currently it is a overbought position which means profit taking will take in place 5) STO - Broke 80% and going up. ( Bullish) but if observed carefully it is retracing and closing in closer to the red line.. Watchout if it goes near back to 80% because currently it is a overbought position which means profit taking will take in place 6) Ichimoku - a) Above support cloud (Bullish). b) Conversion line cross base line (Bearish Crossover). c) Price above the baseline ( Bullish) 7) Candlestick - Shooting star was formed (Slightly Bearish) Next Rrading Day : - Black Candle : Watchout for possible bearish reversal - White Candle - Negate the Bearish effect and will continue to be bullish Conclusion: Bullish Resistance at 13932 / 14156 / 14338 Support at 13570/13348/ 13242/ 12984 / 12803 |
|
|
Nov 16 2012, 09:52 PM
Return to original view | Post
#3
|
|
Senior Member
593 posts Joined: Feb 2009 |
Indicators 1 ) Trendline - below the downtrend line .. ( Bearish ) 2) Support/Resistance - Formed lower low and lower high ( Bearish ) 3) MACD -Bearish Crossover ( Bearish ) . Awaiting for 4R1G signal 4) RSI - Broken below 30% (Bearish) , 5) STO - Broke below 20% and bearish crossover (Bearish) 6) Ichimoku - a) Price coming entering from the support cloud (Bearish). b) Conversion line below the base line (Bearish). c) Price close below the baseline ( Bearish) . 7) Candlestick pattern - Black Candle (Bearish). 8) Market Sentiment - Negative from USA 600B Fiscal Worries Refer link Conclusion: Bearish Yesterday it closed with a spinning top on the support line. It is a 50 - 50 whether it will rebound or break below the support line.. Resistance- 12716 / 12794 / 12964 / 13057 / 13134 / 13335 / 13583 Support - 12531 / 12314 / 12237 / 11757 / 11649 Attached thumbnail(s) 
|
|
|
Nov 18 2012, 11:52 AM
Return to original view | Post
#4
|
|
Senior Member
593 posts Joined: Feb 2009 |
Dow Jones Chart Analysis 16 November 2012

Indicators 1) Trendline - below the downtrend line .. ( Bearish ) 2) Support/Resistance - Formed lower low and lower high ( Bearish ) 3) MACD - Formed 4R1G ( Bullish ) 4) RSI - If break above 30% will indicate bullish.. 5) STO - Bullish crossover (Bullish ) . If break above 20% will indicate more bullish 6) Ichimoku - a) Price coming entering from the support cloud (Bearish). b) Conversion line below the base line (Bearish). c) Price close below the baseline ( Bearish) . 7) Candlestick pattern - Hammer on the support at 12531 (Bullish). Required another white candle to confirm the bullish reversal 8) Market Sentiment - Rise after optimistic budget talk .. ( Click here to refer more ) Conclusion: Bearish Formed a hammer on the support after digesting the Fiscal Fear and optimistic budget talk to resolve the Fiscal Fear issue Resistance- 12716 / 12794 / 12964 / 13057 / 13134 / 13335 / 13583 Support - 12531 / 12314 / 12237 / 11757 / 11649 |
|
|
Nov 18 2012, 11:56 AM
Return to original view | Post
#5
|
|
Senior Member
593 posts Joined: Feb 2009 |
Buy call for Facebook..
After Facebook IPO recently .. It plunge down and went sideways in the trendline between 24.4 to 18.6. 
Indicators 1 ) Trendline - In the sideway trendline between 18.6 to 24.4 . If break up from the 24.4 will indicate bullish. 2) Support/Resistance - Formed double bottom at 18.6 ( Slightly Bullish ) 3) MACD -Bullish Crossover and formed 4R1G ( Bullish ) . 4) RSI - Rebound from 50% and trending upwards (Bullish ) , 5) STO - Rebound from 20% and bullish crossover (Bullish ) 6) Ichimoku - a) Price entering from the support cloud (Slightly Bullish). If break above it will be bullish confirmation b) Conversion line below the base line (Bearish). c) Price close above the baseline ( Bullish ) . 7) Candlestick pattern - White Candle after a bullish harami (Bullish ). Conclusion Bullish If it can break away from the Support cloud and from the sideway trendline above 24.4 it will become more bullish.. Entry Price at 24.6 Stop Loss at 23 Profit at 25.5 E ( Entry) :24.6 ( Closed at or above it) S ( Stop Loss) : 23 P ( Profit) :25.5 RRR (Risk to Reward Ratio) =0.56 (Risky) E ( Entry) :24.6 ( Closed at or above it) S ( Stop Loss) : 23 P ( Profit) :26.5 RRR (Risk to Reward Ratio) =1.19 (Average) E ( Entry) :24.6 ( Closed at or above it) S ( Stop Loss) : 23 P ( Profit) :29 RRR (Risk to Reward Ratio) =2.75 (Slightly Rewarding) Resistance at 22.6 / 23.4 / 24.4 / 25.7 / 26.7 / 29.4 Support at 19/ 18.6 / 17.5 |
|
|
Dec 1 2012, 11:03 AM
Return to original view | Post
#6
|
|
Senior Member
593 posts Joined: Feb 2009 |
QUOTE(edwin32us @ Nov 18 2012, 11:56 AM) Buy call for Facebook.. After Facebook IPO recently .. It plunge down and went sideways in the trendline between 24.4 to 18.6.
Indicators 1 ) Trendline - In the sideway trendline between 18.6 to 24.4 . If break up from the 24.4 will indicate bullish. 2) Support/Resistance - Formed double bottom at 18.6 ( Slightly Bullish ) 3) MACD -Bullish Crossover and formed 4R1G ( Bullish ) . 4) RSI - Rebound from 50% and trending upwards (Bullish ) , 5) STO - Rebound from 20% and bullish crossover (Bullish ) 6) Ichimoku - a) Price entering from the support cloud (Slightly Bullish). If break above it will be bullish confirmation b) Conversion line below the base line (Bearish). c) Price close above the baseline ( Bullish ) . 7) Candlestick pattern - White Candle after a bullish harami (Bullish ). Conclusion Bullish If it can break away from the Support cloud and from the sideway trendline above 24.4 it will become more bullish.. Entry Price at 24.6 Stop Loss at 23 Profit at 25.5 E ( Entry) :24.6 ( Closed at or above it) S ( Stop Loss) : 23 P ( Profit) :25.5 RRR (Risk to Reward Ratio) =0.56 (Risky) E ( Entry) :24.6 ( Closed at or above it) S ( Stop Loss) : 23 P ( Profit) :26.5 RRR (Risk to Reward Ratio) =1.19 (Average) E ( Entry) :24.6 ( Closed at or above it) S ( Stop Loss) : 23 P ( Profit) :29 RRR (Risk to Reward Ratio) =2.75 (Slightly Rewarding) Resistance at 22.6 / 23.4 / 24.4 / 25.7 / 26.7 / 29.4 Support at 19/ 18.6 / 17.5  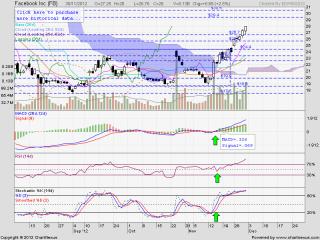
E ( Entry) :24.6 ( Closed at or above it) S ( Stop Loss) : 23 P ( Profit) :25.5 http://static.lowyat.net/style_images/1/fo...icons/icon6.gif RRR (Risk to Reward Ratio) =0.56 (Risky) E ( Entry) :24.6 ( Closed at or above it) S ( Stop Loss) : 23 P ( Profit) :26.5 http://static.lowyat.net/style_images/1/fo...cons/icon12.gif RRR (Risk to Reward Ratio) =1.19 (Average) E ( Entry) :24.6 ( Closed at or above it) S ( Stop Loss) : 23 P ( Profit) :29 RRR (Risk to Reward Ratio) =2.75 (Slightly Rewarding) |
|
Topic ClosedOptions
|
| Change to: |  0.0606sec 0.0606sec
 0.63 0.63
 7 queries 7 queries
 GZIP Disabled GZIP Disabled
Time is now: 4th December 2025 - 12:11 PM |
 Quote
Quote