

the best opportunity I spoted today. Now I fully wait for this one
Attached thumbnail(s)

FOREX TRADING HQ VER 4, Speculators, scalpers and traders wanted
|
|
 Nov 28 2008, 12:26 PM Nov 28 2008, 12:26 PM
Return to original view | Post
#461
|

Senior Member
2,214 posts Joined: Oct 2007 |
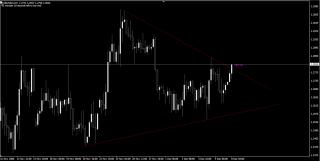
NZDUSD
the best opportunity I spoted today. Now I fully wait for this one Attached thumbnail(s)
|
|
|
|
|
|
Nov 28 2008, 07:06 PM
Return to original view | Post
#462
|
|
Senior Member
2,214 posts Joined: Oct 2007 |
EU monthly big picture
Attached thumbnail(s) 
|
|
|
Nov 29 2008, 02:41 AM
Return to original view | Post
#463
|
|
Senior Member
2,214 posts Joined: Oct 2007 |
What is this? My mt4 got prob?
Attached thumbnail(s) 
|
|
|
Nov 29 2008, 04:52 PM
Return to original view | Post
#464
|
|
Senior Member
2,214 posts Joined: Oct 2007 |
Whole BIG picture right now. I spending around 4h (not yet include yesterday night) to think think think and think.
Now, How to prove that I'm wrong? If the price break 1.5560 and direct goes down. We're dead fish. Means my analysis today is ALL WRONG. Means the market is going down. On fundamental side, (1) Santa Rally - Brings the market UP (2) Year End, Government will try to do their best to make sure their year end record tends to be a better result. Tat is why I think it will goes UP. I holding EU long, you can see from the chart. I mostly wont close the trade unless it breaks 1.5560, I will either LOSE damn pain, Or either WIN back. Belows is the news about DOW and OIL, have a look on that. http://www.cnbc.com/id/27949592 Discussion on DOW, DOW monthly chart is a hammer, indicators showing +ve divergence. We're heading UP (for me) Dow Friday goes up closed with +133. DOW CHEONG UP jor. Discussion on OIL Yesterday night, last 3 hour of OIL trading hours, OIL spike up 52 to 55 in 1 hour. Finally closed above 55. So we will expect a GAP up on EU by monday. BUT BUT BUT: OPEC report today will be out, if supply cut off, we win EU. if supply didn't cut off, we damn EU. Here's the news about the posibility that OPEC may not cut the production. http://www.cnbc.com/id/27956451 This post has been edited by mphpopular: Nov 29 2008, 05:02 PM Attached thumbnail(s) 


|
|
|
Nov 29 2008, 06:11 PM
Return to original view | Post
#465
|
|
Senior Member
2,214 posts Joined: Oct 2007 |
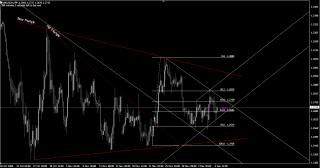
I finally know how to make the price together with FIBONANCI.
Refer the following. Attached thumbnail(s) 
|
|
|
Nov 29 2008, 08:34 PM
Return to original view | Post
#466
|
|
Senior Member
2,214 posts Joined: Oct 2007 |
Haha. Finally we got the answer. I also get it from others. Besides, GO open all major pairs and look on monthly chart. The monthly candle, for most of the pairs will be either HARAMI or DOJi. Very BIG BIG uncertainty in market.
|
|
|
|
|
|
Nov 29 2008, 09:03 PM
Return to original view | Post
#467
|
|
Senior Member
2,214 posts Joined: Oct 2007 |
Clue.
Added on November 29, 2008, 9:41 pm QUOTE(Kimihim @ Nov 29 2008, 08:59 PM) Good Day guys.. Another one have join us, WelcomeI am part time trader - I will focusing only on very less volatile pair.. Hope can be part of you guys all timer in this bussiness. I trade purely base on chart/technical analysis as I have no time to analyse fundamental..Lazy me ..  EURGBP - 4HR Next week - Foresee price will further retrace down to 61.8 from last BULL run and I expect price will bounce from that Fib level and along orange TL. My trade idea are BUY at the most cheapest price I can get as long as orange TL hold. If TL give away - then I will change my trade plan.. Good Luck  This post has been edited by mphpopular: Nov 29 2008, 09:41 PM Attached thumbnail(s) 

|
|
|
Dec 1 2008, 01:07 AM
Return to original view | Post
#468
|
|
Senior Member
2,214 posts Joined: Oct 2007 |
I'm still improving myself on locating the divergence. Plz correct me if I'm wrong.
Attached thumbnail(s) 
|
|
|
Dec 1 2008, 07:42 AM
Return to original view | Post
#469
|
|
Senior Member
2,214 posts Joined: Oct 2007 |
Means when on UT, we use HH. when in DT, we use LL. Am I right?
|
|
|
Dec 1 2008, 09:46 AM
Return to original view | Post
#470
|
|
Senior Member
2,214 posts Joined: Oct 2007 |
Thanks, you show me a good point.
|
|
|
Dec 1 2008, 04:27 PM
Return to original view | Post
#471
|
|
Senior Member
2,214 posts Joined: Oct 2007 |
QUOTE(WhitE LighteR @ Dec 1 2008, 11:29 AM) I myself never tried Stoc before. So far i've only tried RSI and MACD. MACD gives u much more information. You can try to take a look at tht... plus macd also can show u divergence.... way before the crossover comes.. cun lea? I'll be not around for this week. But juz post me an example so that I could get some basic info from your chart. Thanks in advance. Divergence, I'm new. LOL |
|
|
Dec 1 2008, 05:39 PM
Return to original view | Post
#472
|
|
Senior Member
2,214 posts Joined: Oct 2007 |
GU
Attached thumbnail(s) 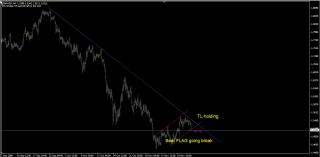
|
|
|
Dec 3 2008, 01:43 PM
Return to original view | Post
#473
|
|
Senior Member
2,214 posts Joined: Oct 2007 |
I'm in hometown now. I cant post a chart for right now.
H&S which has broken on H1 tat day, the technical target have reached. But open up EU m15 chart. Price struggling btw 2683 & 2741. Draw two horizontal line there. So now wait for breakout. I prefer a breakdown happen. If breakup, I long wif care. Open H4 chart. You can draw a DT channel. From 25/11 until 01/12. The price now moving horizontally and almoz reach the upper line of the CHannel. SO preferable a short will be happen. If you are uncertain with what you drew. Try to post up the chart and I can correct you. |
|
|
|
|
|
Dec 6 2008, 07:29 AM
Return to original view | Post
#474
|
|
Senior Member
2,214 posts Joined: Oct 2007 |
Posible trade for next week:
AU 05Dec08 Weekly Analysis.   |
|
|
Dec 6 2008, 07:52 AM
Return to original view | Post
#475
|
|
Senior Member
2,214 posts Joined: Oct 2007 |
EU current outlook for me. Full of mist.
Attached thumbnail(s) 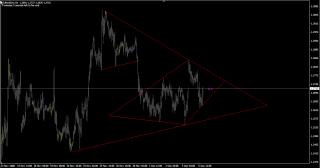
|
|
|
Dec 6 2008, 03:24 PM
Return to original view | Post
#476
|
|
Senior Member
2,214 posts Joined: Oct 2007 |
I'm too free today. Drawing and drawing. This is what I've done for AU.
Attached thumbnail(s) 


|
|
|
Dec 6 2008, 09:00 PM
Return to original view | Post
#477
|
|
Senior Member
2,214 posts Joined: Oct 2007 |
Weekly most recommended. I gonna short it gao gao.
Attached thumbnail(s) 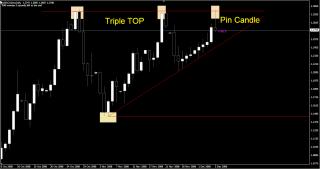
|
|
|
Dec 7 2008, 10:16 PM
Return to original view | Post
#478
|
|
Senior Member
2,214 posts Joined: Oct 2007 |
I will short wif care. Somethin like this bah, I biased short in Daily TF.
So when I trade on m15 h1 TF, I will only pick short, long, i pick wif care. |
|
|
Dec 8 2008, 02:29 PM
Return to original view | Post
#479
|
|
Senior Member
2,214 posts Joined: Oct 2007 |
all break the TL alrady.
AU break yellow TL, now should aim for red tl. EU broken also. Attached thumbnail(s) 
|
|
|
Dec 8 2008, 04:30 PM
Return to original view | Post
#480
|
|
Senior Member
2,214 posts Joined: Oct 2007 |
QUOTE(orangysb @ Dec 8 2008, 04:09 PM) I'm glad i'm in this forum reading this thread haha, thanks mphpopular i just made 100 pips longing AU. Finally you know what to do. Forums is to share opinion. My objective in forum is, I wanna see others chart. See what important point that I've missed out during my drawing. So that I wontget caught in any uncertainty.I think it's time for me to study technical analysis and not just following forums and wildly guessing hehe. |
|
Topic ClosedOptions
|
| Change to: |  0.0452sec 0.0452sec
 0.38 0.38
 7 queries 7 queries
 GZIP Disabled GZIP Disabled
Time is now: 6th December 2025 - 12:57 PM |
 Quote
Quote