

total of 3 sens per 1,000 units
Of which, 0.91 is subjected to 25% tax
2.1 sens is tax exempted
Airasia, Airasia
Airasia, Airasia
|
|
 Apr 29 2011, 12:19 AM Apr 29 2011, 12:19 AM
Return to original view | Post
#1
|

Junior Member
43 posts Joined: Mar 2011 |
total of 3 sens per 1,000 units
Of which, 0.91 is subjected to 25% tax 2.1 sens is tax exempted |
|
|
|
|
|
May 7 2011, 08:36 PM
Return to original view | Post
#2
|
|
Junior Member
43 posts Joined: Mar 2011 |
Too bad the 3.13 only last for few minute of the days and miss the chance to close position.
Upside: MACD is still pretty positive about this up-trend which started on 28/April (20% in 6 session) and no sign of rounding top yet, but MACD is a lagging indicator. Institution is buying for the past 2 trading session but EPF is in selling mode. Break historical high of 3.05 albeit close at 3.06 due to profit taking, typical friday. Downside: The candle stick has been out of Bollinger band for 6 consecutive session, how many more it can sustain. (My bet is max 2 more session before it trade within the band again) The most i have seen in recent year is 11 on Hapseng. Probably the main catalyst comes from the Thai/Indo listing exercise. Maybe it is wise to plan the timing for exit now and wait for a more reasonable level. For non-holder, in light of the limited upside, waiting might be the best option for now.. |
|
|
May 10 2011, 09:27 PM
Return to original view | Post
#3
|
|
Junior Member
43 posts Joined: Mar 2011 |
erm, true enough it only sustain for 7 session and the price is back to the band of daily chart again. Question is where will it head next.
Maybe can get a bit of clue from the 30 minutes chart, seems like the price in last 1 trading hour has deviated out of the band and theoretically this should push the price back to the band in the next day. But the 30 minutes chart probably also signal a lower low and could it be the price will be heading south after a short life rebounce? Back to the transaction side, 3.13 is transacted in the opening 20 minutes chasing mainly by the retail investor and this is not really a good sign. The price erode without the support from the big buyer and hopefully tomorrow can sustain above 2.97 for the trend to continue. Attached thumbnail(s) 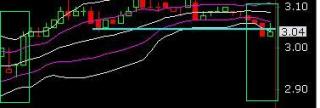
|
|
|
May 12 2011, 04:53 PM
Return to original view | Post
#4
|
|
Junior Member
43 posts Joined: Mar 2011 |
Was it a Hangman by coincidence? Hopefully yes since the long tail is large contributed by early panic selling in the morning session. Who knows, maybe it will turn up to be a powerful hammer.
On a side note, the big boy turn into net seller in today session. Attached thumbnail(s) 
|
|
Topic ClosedOptions
|
| Change to: |  0.0165sec 0.0165sec
 1.81 1.81
 7 queries 7 queries
 GZIP Disabled GZIP Disabled
Time is now: 8th December 2025 - 11:35 PM |
 Quote
Quote