QUOTE(small-jeff @ May 4 2008, 10:33 PM)
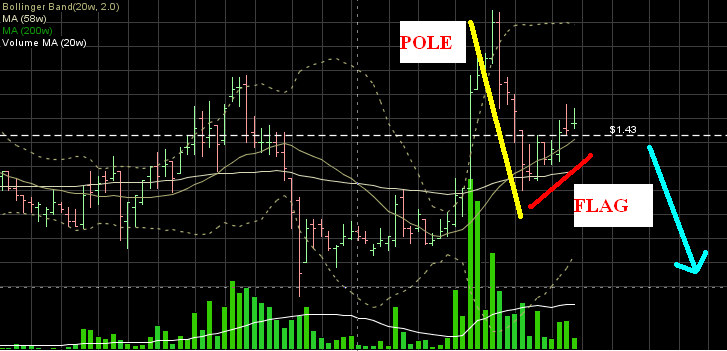
here...edited the pic to show bearish flag...
» Click to show Spoiler - click again to hide... «
hm..to me..smart people always knows where the direction of the chart is going de..they only make false BO to trap ppl so ppl will believe there's a reversal or something, after that, the chart will go back to its supposed to be direction...so, knowing the direction of the price, can sometimes ignore that there're smart money le..

IMO, usually flag is caused by market makers, giving false impression of reversal...but sometimes, a flag can become a reversal

haha..at least use RSI or Stochastic ba...you dont want long when it's overbought
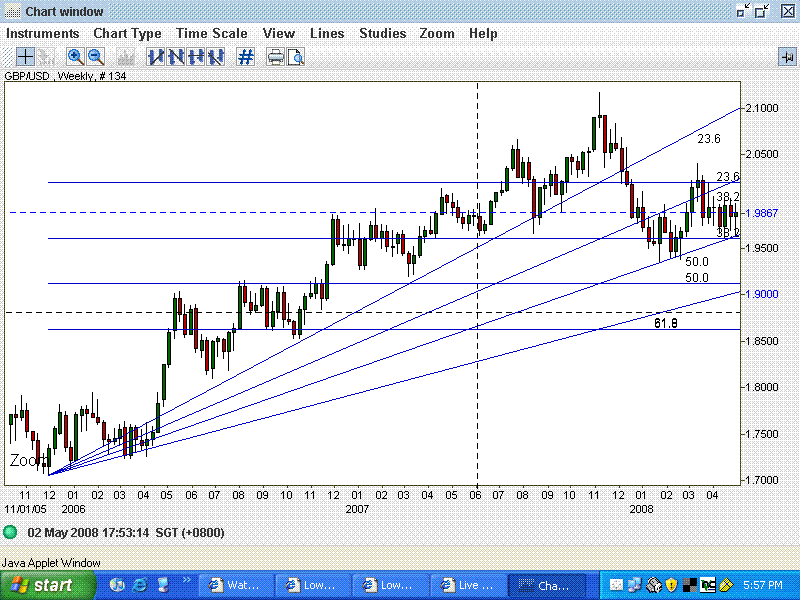
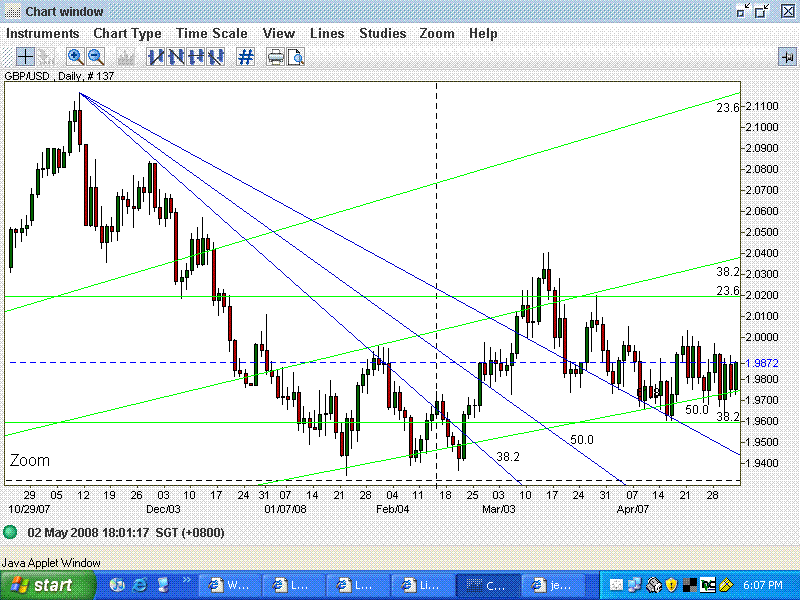
haha...Fibs and Gann works in every market prices. I read through "Fibonacci and Gann Applications in Financial Markets - George A. Maclean", and also the ebook you recommended
but i still havent really been able to apply Gann's tools yet

Fib fan is applied like Fib retracement. Usually i'll apply it in various time frames' high/low, both the vertical retracement and the fan together, then compare the retracement level of different time frame. From there, you'll see how easy/difficult is it for the price to make its directional movement. However, Fibs are only good when the market is rather volatile or moving relatively violent (IMO lar)..if the price is channelling; sideways, bearish of bullish, not so good to apply..
ooo... will go through that book when i hav time...

btw, i think it's cant b categories as flag as it is more than 1 month... this is suggested by bulkowski
Characteristic
QUOTE
-Prices bounded by two Price action bounded by two parallel trend lines. Prices
trend lines usually go against the prevailing trend: They rise in a downtrend
and fall in an uptrend, but exceptions are common.
-Three-week maximum Flags are short, from a few days to 3 weeks. Formations
longer than 3 weeks are better classified as symmetrical
triangles, rectangles, or wedges (rising or falling).
-Steep, quick price trend These formations usually form near the midpoint of a steep,
quick price trend. If you do not have a strong advance or
decline leading to the chart pattern, ignore the flag.
-Downward volume trend Volume usually trends downward throughout the formation.
i think d correct name shud b measured move down -Corrective phase > Prices can move horizontally but usually rise and recover from 38% to 62% of the prior decline before resuming the downtrend. If the
corrective phase nears or rises above the first leg high, look
elsewhere.
edited: hmm... mayb u right... i shud look at other indicator as well for strong confirmations...
This post has been edited by low yat 82: May 4 2008, 11:17 PM 

 May 1 2008, 07:51 PM


 Quote
Quote


 now they charge rm120 yearly for EOD data... crap... force me to find other source...


 0.0556sec
 0.47
0.47
 7 queries
 GZIP Disabled