

 Jun 1 2021, 12:29 AM, updated 11 months ago

Google spreadsheet link
https://docs.google.com/spreadsheets/d/1Mfi...dit?usp=sharing
Features
- Summary of your expenditure and savings per month, throughout the year.
- Net worth summary which plucks the numbers from your spreadsheet to help you track your investments allocation.
- Link your previous/next spreadsheet to bring forward the calculations across your spreadsheets.
- Upgrade your spreadsheet to the template's latest version to enjoy new features.
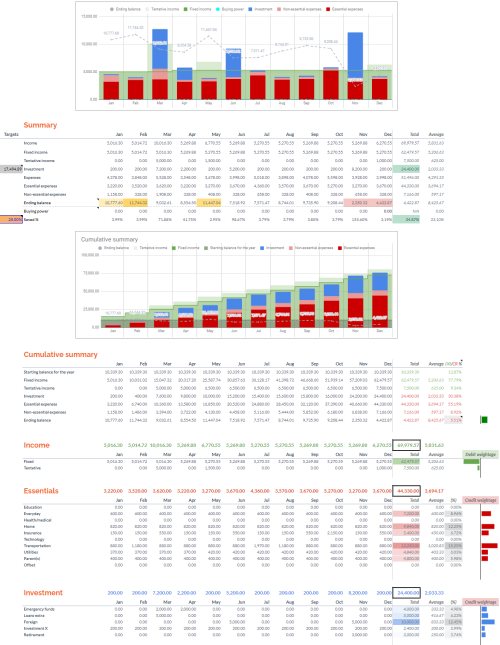
Sample summary:
What does it mean to have a good plan?
The sheet contains various conditional formatting to tell you whether there's something good/bad. In general, I use the traffic light colouring: red is bad, yellow is "almost there", green is good. Let's look at some of the details below.
Summary > ending balance
You may notice red/yellow indicators.
Red means you have not enough for the next month. The sheet tracks your budget monthly and that strictly means from first day to last day of the month, e.g. 1-29 February 2020, 1-30 June 2021 etc. Having that said, it does not have the level of detail to tell you how much you're spending by day; this sheet cannot tell you how much you will spend on 20 June, and how much you will have left by the end of that day. What this sheet does however, is that it assumes all your expenses are clocked in on day 1 of the month, and your salary comes in much later. This means, in order to have a healthy plan, you need to have enough ending balance on the month before, to cover for the next month, e.g.
Income = 10k
Jan ending balance = 2k
Feb expense = 5k
Result > Jan ending balance is shown as red, as it is NOT enough to cover for Feb expenses. It assumes that Feb's income will not come on time.
Note:
- investments are not calculated as part of the expenses. This sheet assumes that your investments will be done AFTER your pay day of the month, so that in case you have extra expenses, the first outflow you can cut is your investment, without affecting the your life comforts i.e. the essentials and nonessentials. This is to provide more flexibility for you to manage for when you get your huge bonus for the month, that you want to do the investment in the same month itself, without hurting your KPI directly (i.e. red ending balance indicators even though you know it's fine).
Yellow means you have too much idle cash; the current threshold/formula = your income * 2. This sheet intends to facilitate investments/savings. The ending balance is meant to kept at a healthy "just enough" level, while allowing you to slowly "plant your money tree" to save for the rainy days. As you start your journey in financial planning, investment will eventually come into the picture because money depreciates; you need to let the power of compounding help cushion the fall. Meaning, you need to let your money generate more money for you. But it does not have to be risky investments that do not fit your appetite; that is all up to you, and it is completely up to you to decide where you will keep your extra cash -- all you have to do is jot that down under Investment tab. I have yet to figure out a good way to visualise extraction your invested money to cover for sudden shortfalls.
Summary > buying power
This answers "how much can I splurge this year?" Notice the value never exceeds a certain point even though your ending balance is much higher -- this is because the amount you can splurge is not simply the ending balance, but it also takes account of:
- how much you're supposed to invest up to that month
- how much needed for subsequent month expenses
Note: having 3,000 buying power on March, but 2,000 on April, means that you're NOT supposed to YOLO spend all 3,000 on March itself. Because, in doing so, you will end up in 1,000 deficit once you enter April, as indicated by the red ending balance if you add a 3,000 expenditure.
Summary > Target savings
Dictated by your % target based on your income.
Green = target reached
Yellow = almost there
Red = far from target
This is completely up to you. You ought to balance this out with your expenses and buying power, so that you can have a comfortable life for yourself, while not forgetting to save. The sheet guides you by telling you result of your configurations and inputs, but ultimately, you're the one deciding how much you should save, or spend.
Summary > Debit/Credit weightage
Visualises your debit (money in) vs. credit (money out) to see distribution of your expenses throughout the year. Ending balance is counted towards credit weightage to balance DR/CR. When balance is negative, it is displayed as red to the left.
Developer's note
This is my little personal project to publish it for everyone to use, for free. Please feel free to PM me for any question/support regarding this spreadsheet, or financial planning in general, to manage your expenditures better. Note that I am not qualified and do not provide investment advice.
My motivation comes from wanting to improve my own sheet, since I'm the #1 user after all! However, I do want this to work for more people too, so I want to know what you think about my spreadsheet, and whether you would like to use it:
If "not yet", what's stopping you?
If "no", why not?
Eventually, if time+passion+effort allows, I hope to come up with more formal guidelines (like YouTube videos) and channels to support this project.
This post has been edited by Takudan: Jul 1 2023, 08:50 PM
 Quote
Quote


 0.0234sec
 0.26
0.26
 5 queries
 GZIP Disabled