

 Dec 9 2024, 09:11 PM

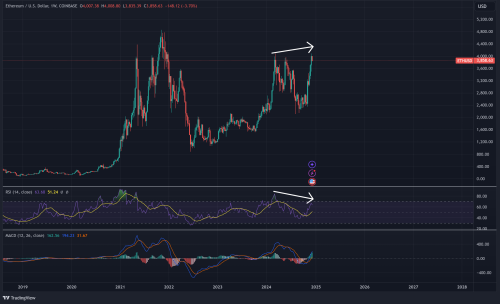
Weekly ETH. Not yet printed. Still got chance to cancel the bearish divergence if pump up aggressively (non stop). ETH story has been a sad one. During the bear market, I dont see any accumulation zone. Only small accumulation zone at 2200-2300. That might explain the weak bull for ETH. I hope next bear will see ETH accumulation zone (it should).
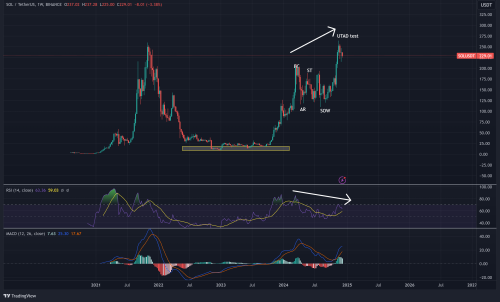
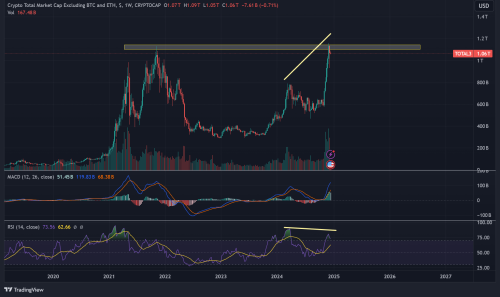
Solana Weekly chart story, It has been a great run since it the accumulation zone. Bottom to top is 2300% gain. However, the weekly divergence already printed and it is now doing the UTAD test.
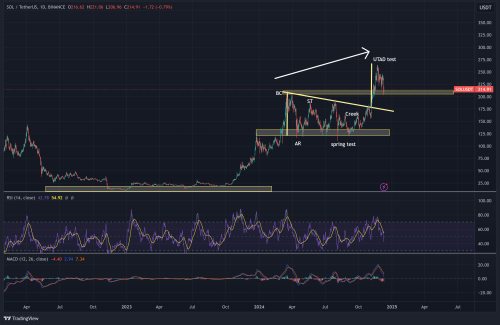
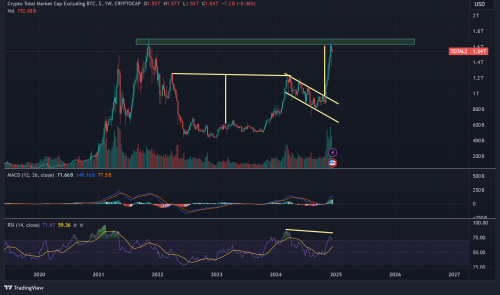
Wait Solana daily chart is legit accumulate pattern also.
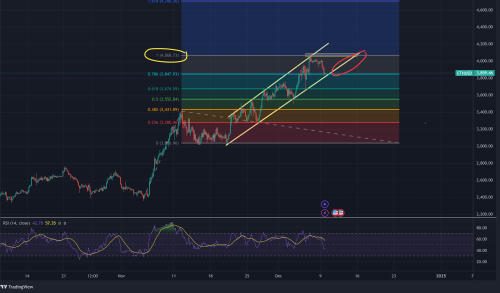
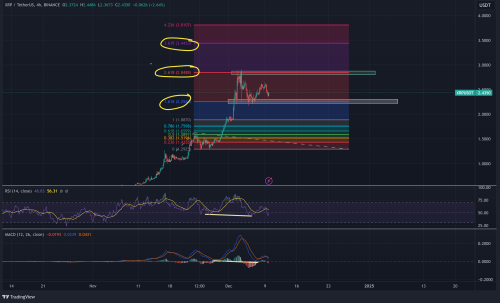
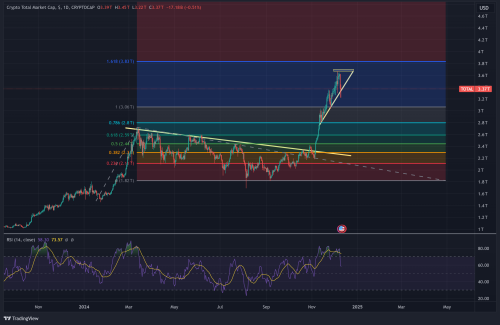
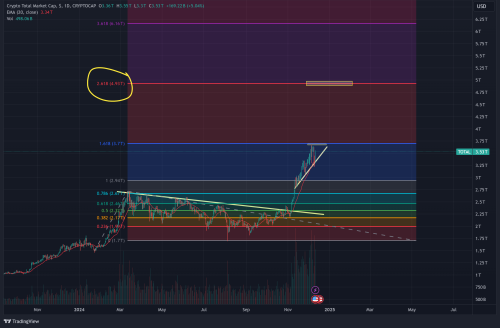
Here come the main event of this cycle XRP. It consolidate between 2 fibonnaci extension levels. I can see got accumulation going on at $2.2. I dont see any bearish sign yet. Instead there is hidden bullish divergence, hence high possibility it will go retest $2.8, if breakthrough next level should be $3.44. I wonder what is there $3.44? My tradingview cant see
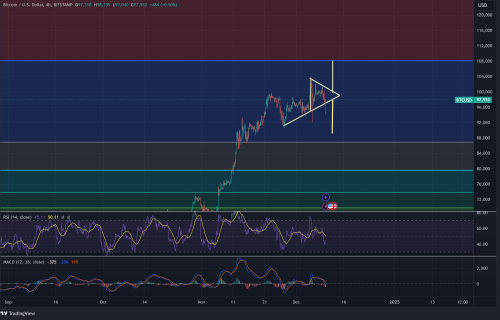
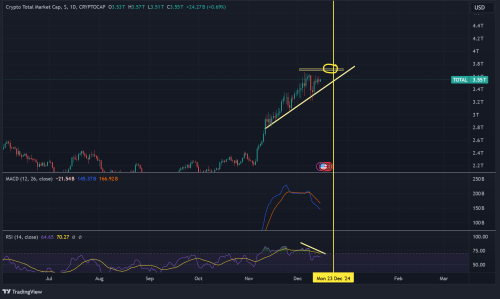
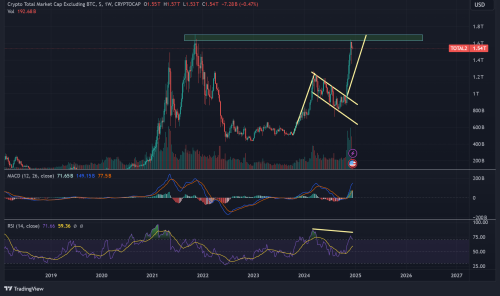
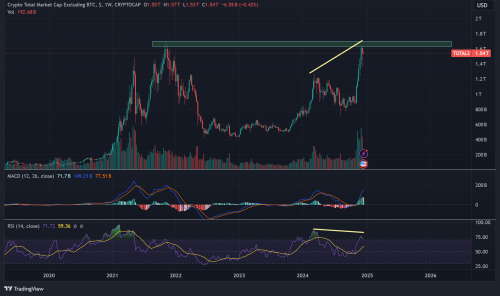
And never forget doge musk. That is american flag pattern
 . That kind of RSI look like consolidating. I think it is not a bearish divergence. This is a case study. First time see this kinda of RSI & such flag pattern. Can break both ways.
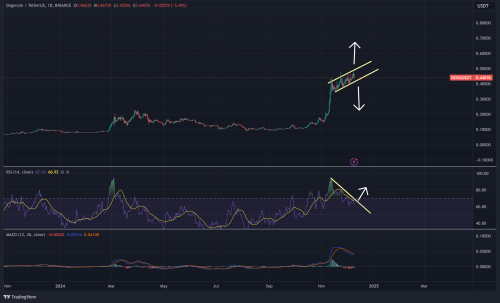
This post has been edited by mois: Dec 11 2024, 07:39 AM
 Quote
Quote


 0.0666sec
 0.73
0.73
 7 queries
 GZIP Disabled