Very difficult to answer such a simple question.
First it depends the type of trading you are good. Are you a daytrader? 3 days trader? A week? Longer? Or even longer, longer?
14 days is considered way too slow if you are good at fast trading.
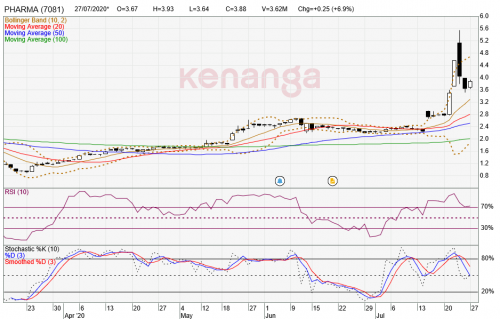
Hence, some even use 10 days intervals. Some have even modify to even 7.... but what to use, has to suit you the user.
Internet got plenty of suggestions...
I use none, which suits me fine after years for testing... (which I suggest you to do the same)
(you can search 'chart indicators not reliable')
but again... what matters is you. Test it out yourself... find out what works best in your setup and not rely on others)

So you trade solely based on the candlesticks? That's a very unique way to trade, first time see man!
Coming from a fundementalist investor, damn mind boogling for me to comprehend technical indicators also haha


 Jul 26 2020, 01:54 PM
 Quote
Quote
 Coming from a fundementalist investor, damn mind boogling for me to comprehend technical indicators also haha
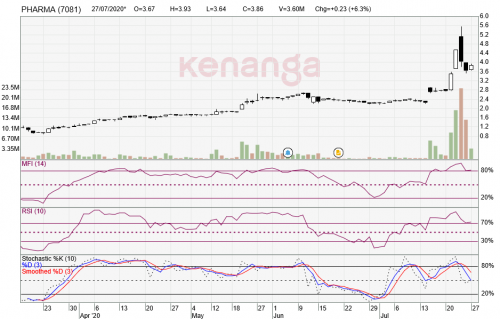

 0.0686sec
 0.23
0.23
 7 queries
 GZIP Disabled