

Anyone got top up CIMB global titan?
Fundsupermart.com v12, Najibnomics to lift KLCI?
Fundsupermart.com v12, Najibnomics to lift KLCI?
|
|
 Oct 19 2015, 05:47 PM Oct 19 2015, 05:47 PM
Return to original view | Post
#1
|
 
Junior Member
144 posts Joined: May 2010 |
Anyone got top up CIMB global titan?
|
|
|
|
|
|
Oct 19 2015, 07:35 PM
Return to original view | Post
#2
|
|
Junior Member
144 posts Joined: May 2010 |
QUOTE(yklooi @ Oct 19 2015, 07:26 PM) see post# 330, page# 17 lol ok got someone top up ~ |
|
|
Oct 20 2015, 11:25 AM
Return to original view | Post
#3
|
|
Junior Member
144 posts Joined: May 2010 |
Hi , Just want to ask about the NAV price for CIMB fund
I saw the latest pricing for Global Titan is this, the price stated as of 16 October CIMB-Principal Global Titans Fund 0.8603 October 16, 2015 seem like it is 2 days delay on this, If let say I buy today, what is the price that I will get ? price at 19 October? or 20 October? What is the cut off time? Thanks. |
|
|
Oct 20 2015, 11:37 AM
Return to original view | Post
#4
|
|
Junior Member
144 posts Joined: May 2010 |
QUOTE(Pink Spider @ Oct 20 2015, 11:35 AM) DON'T BOTHER If don't bother, how could I know the price that I purchase?Seriously, don't bother |
|
|
Oct 20 2015, 01:13 PM
Return to original view | Post
#5
|
|
Junior Member
144 posts Joined: May 2010 |
QUOTE(yklooi @ Oct 20 2015, 12:07 PM) Q: WHEN WILL I KNOW ABOUT THE PRICE I GET? Thank you, this is what I want to know ~~A: Most of the unit trusts in Malaysia are priced based on "forward pricing". This means that if you transact today, you will get the fund’s value as of the closing price of the market today. However, you will know the price in two working days The price that you could see in the website is the so-called 'indicative price'. This is usually the price of the fund two working days ago. This indicative price is NOT the actual transaction price of the fund that you are buying or selling. Generally, the fund manager requires approximately two business days to consolidate and derive a unit price for the funds. These prices are further valued independently by the fund's trustees. Therefore, the dealing price will be made known to the public two business days after the transaction date. Once we obtained the price, an email notification will be sent to you. Q: WHEN WILL MY BUY ORDERS BE TRANSACTED? A: Cheque Payment/Internet Bill Payment Your buy orders will only be transacted when we receive your payment. Once we received your cheque/Internet bill payment for your orders before 3pm on each business day, your orders will be transacted on the same day. Cheques/Internet bill payment received after 3pm or on a non-business day will be transacted on the next business day http://www.fundsupermart.com.my/main/faq/W...ce-I-get-1605#3 |
|
|
Oct 20 2015, 03:06 PM
Return to original view | Post
#6
|
|
Junior Member
144 posts Joined: May 2010 |
Hi All I got another question, lol... regarding about the charting
Growth/Performance chart vs Price chart As you can see at below, this is the morning star and public mutual performance/ growth chart the chart is nice and keep increase and up every years. Public Mutual performance chart 
Morning star growth chart 
but when you check on the price it doesn't seem to increase every year Morning star price chart 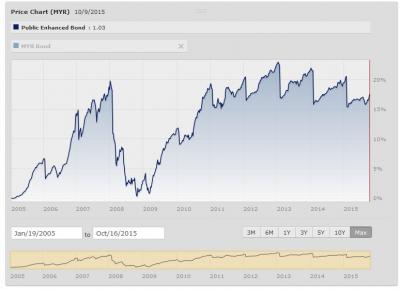
So, I wonder how the performance/ growth chart been calculate or plotting? It is taking the starting/Launch price as a standard? Meaning to say that if the price of the current fund are higher than the starting/Launch price then it consider growth? Am I right? anyone know how is the chart been calculate for the performance/ growth chart? Thanks ! |
|
|
|
|
|
Oct 20 2015, 03:19 PM
Return to original view | Post
#7
|
|
Junior Member
144 posts Joined: May 2010 |
QUOTE(yklooi @ Oct 20 2015, 03:12 PM)  maybe the morning star chart DID not take into consideration of Dividend payout? maybe the morning star chart DID not take into consideration of Dividend payout?why not try this PM fund performance charting tool? http://www.publicmutual.com.my/application...formancenw.aspx as you can see performance/growth up != NAV price up |
|
|
Oct 20 2015, 03:28 PM
Return to original view | Post
#8
|
|
Junior Member
144 posts Joined: May 2010 |
QUOTE(yklooi @ Oct 20 2015, 03:24 PM) did it show NAV price up? or did it shows the Total Returns in %?this is the morning star growth chart description, but I still not quite understand on this? how the value been calculate? will it related to NAV price? http://www.morningstar.com/InvGlossary/growth_graph.aspx |
|
|
Oct 20 2015, 03:51 PM
Return to original view | Post
#9
|
|
Junior Member
144 posts Joined: May 2010 |
QUOTE(yklooi @ Oct 20 2015, 03:35 PM) see blue replies... ya , I think that is the total return as the blue legend show there( I can see the chart in morning star vs pb mutual are alike) , but how the total return or this chart been calculate, this is my question. |
|
|
Oct 20 2015, 04:00 PM
Return to original view | Post
#10
|
|
Junior Member
144 posts Joined: May 2010 |
QUOTE(yklooi @ Oct 20 2015, 03:55 PM) I googled and found this...hope it helps... yeah I also google before posting here, but this is not explaining about the performance chart.How to Calculate and Read Public Mutual Fund Performance Chart http://www.horlic.com/how-to-calculate-and...formance-chart/ more in google... |
|
|
Oct 20 2015, 05:59 PM
Return to original view | Post
#11
|
|
Junior Member
144 posts Joined: May 2010 |
QUOTE(idyllrain @ Oct 20 2015, 05:53 PM) The price chart just shows the NAV price. Quick example: Hi, Thank for the explanation, but for Month 4 : how come the value become RM26666.67. even the NAV stay Rm2.00?Month 1: Buy 10000 units @ RM1.00 Month 2: NAV is RM2.00. Value of investments become RM20000. Month 3: NAV is RM2.00. Fund declares distribution RM0.50. NAV becomes RM1.50. Value of holdings still RM20000 Month 4: NAV is RM2.00. Value of holdings become RM26666.67. Looking at the price chart for these 4 months, you'll see it go up down up back to same spot. If you look at the performance/growth chart however, it'll go up only. Meaning to say that , performance/growth chart vs price chart the only different is performance chart are including those distribution, but price chart are not(as it purely track on the price). Am I right? |
|
|
Oct 21 2015, 08:18 AM
Return to original view | Post
#12
|
|
Junior Member
144 posts Joined: May 2010 |
QUOTE(j.passing.by @ Oct 20 2015, 07:43 PM) The performance chart shows the real growth of the fund. It has nothing to do with its NAV price. Meaning that is the same as what idyllrain explained right?The NAV price of UT is not the same as stock price. And "income distribution" is not same as in stock's dividend. The NAV price is adjusted DOWN after each income distribution. So it is meaningless to make a chart on the NAV price. The NAV price usually means the price per unit. After an income distribution, and if the distribution is re-invested, you will be getting more units. Lastly, a Public Mutual bond fund is usually launched at RM1.00. Even if it had grown several hundreds percent, it will not go beyond RM2.00. Usually within range of RM1 plus/minus 10 or 20 sens. I find it very misleading when sites make charts on NAV prices, and to put NAV prices as a watchlist to time the entry into the fund.  The author in that linked article was trying to explained that the Performance Chart do not includes the service charges. When the service charge is included into your investment to calculate the ROI, there is a difference. The performance chart shows the growth of the fund at any given time. It shows the growth of your investment EXCLUDING the service charge. as example below Month 1: Buy 10000 units @ RM1.00 Month 2: NAV is RM2.00. Value of investments become RM20000. Month 3: NAV is RM2.00. Fund declares distribution RM0.50. NAV becomes RM1.50. Value of holdings still RM20000 Month 4: NAV is RM2.00. Value of holdings become RM26666.67. |
|
|
Oct 21 2015, 08:18 AM
Return to original view | Post
#13
|
|
Junior Member
144 posts Joined: May 2010 |
QUOTE(idyllrain @ Oct 20 2015, 09:21 PM) Ah, that's because of the distribution. You have: Ok, got it thanks!Before distribution: 10000 units worth RM2.00 each. After distribution: 10000 units worth RM1.50 each + RM5000 (distribution was RM0.50 per unit x 10000). This RM5000 is reinvested to purchase more units at RM1.50 per unit, so RM5000 / RM1.50 = 3333.33 units. Bringing your total amount of units to 13333.33. In Month 4, when the price goes back up to RM2.00, the value of your holdings become 13333.33 x RM2.00 = RM26666.67. Basically distribution turns a portion of the value of each unit into money (RM2.00 = RM1.50 + RM0.50). More or less, yeah. For funds that don't do distributions/unit splits etc, the price chart will be the same as the performance chart. |
|
|
Oct 21 2015, 10:37 AM
Return to original view | Post
#14
|
|
Junior Member
144 posts Joined: May 2010 |
Since the price NAV for some fund are delay, if oversea fund will delay 2 days , local will be delay 1 day.
I have some question on this let say Fund A(Oversea fund) bought APPLE share APPLE SHARE(98 USD - NAV for FUND A 1.00) - 19 October (US time zone -4 UTC) APPLE SHARE(100 USD - NAV for FUND A 1.08) - 10 AM, 20 October(US time zone -4 UTC) (converted to our Malaysia time is around 10 PM, 20 October So my question here, If I place an order to buy the Fund A at 4PM,20 October in Malaysia time, what is the NAV I actually get? Is 1.00 or 1.08? if 1.00 meaning is the yesterday price, and if 1.08 is the future price. and If I place an order to buy the Fund A before 3PM,20 October , if it get the yesterday price(1.00), meaning that we actually more or less can predict the Fund A price based on the US market respond yesterday, Am I right? This post has been edited by yeah016: Oct 21 2015, 10:45 AM |
|
|
Oct 21 2015, 01:41 PM
Return to original view | Post
#15
|
|
Junior Member
144 posts Joined: May 2010 |
QUOTE(yklooi @ Oct 21 2015, 11:04 AM) is the holding of the funds are ALL index linked stocks? Assume that the fund fully bought in the US share market only. I know this these are all the factor might affect the NAV price but what my question is not regarding to this...did all the stock prices in the holdings fall at the same rate? is there any currencies exchange variances? is all the holdings in the funds the same..(did the FM buy or sell anything in that day)? are some of the considerations too... |
|
Topic ClosedOptions
|
| Change to: |  0.0481sec 0.0481sec
 0.47 0.47
 7 queries 7 queries
 GZIP Disabled GZIP Disabled
Time is now: 6th December 2025 - 07:10 PM |
 Quote
Quote