

 Nov 1 2015, 01:56 PM

QUOTE(idyllrain @ Oct 31 2015, 02:38 PM)
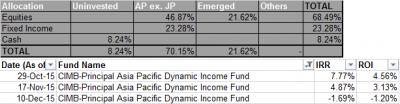
Since putting in the functionality to grab fund prices from FSM, I've been devising a way to track the value of my portfolio. This is what I've come up with:

What it does is that every time I update my fund prices, it will snapshot the current investment per fund, current value of your investment per fund, and the NAV price for that day. This daily information is then used to construct this chart. The chart itself is dynamic and you will not have to add in more graphs when you add in new funds in the future.
There is no requirement to update every day (it will only be more accurate) and some days the historical data may be inaccurate as FSM can be slow with their Fund Price updates (you can go in and fix this manually if you wish but in the long run it should be insignificant).
Is this something you guys will be interested in?
p/s: Yellow line represents absolute profit/loss

Do you mind sharing your excel with this chart? You can mask the data / put dummy values to protect the privacy of the investments. What it does is that every time I update my fund prices, it will snapshot the current investment per fund, current value of your investment per fund, and the NAV price for that day. This daily information is then used to construct this chart. The chart itself is dynamic and you will not have to add in more graphs when you add in new funds in the future.
There is no requirement to update every day (it will only be more accurate) and some days the historical data may be inaccurate as FSM can be slow with their Fund Price updates (you can go in and fix this manually if you wish but in the long run it should be insignificant).
Is this something you guys will be interested in?
p/s: Yellow line represents absolute profit/loss
QUOTE(yklooi @ Oct 31 2015, 05:45 PM)
 continuous and continual improvement....that is good.
polarzbearz...pls have a look...and add in if ok?....
 but not in IRR? represents absolute profit/loss not that great to reflect the performance of my investment as mine is just few thousands RM others maybe of few hundreds thousands RM....the chart may not reflect for comparison?
 Quote
Quote

 0.0195sec
 0.50
0.50
 7 queries
 GZIP Disabled