

QUOTE(Pink Spider @ Oct 20 2015, 02:35 PM)
0.8% x 365 = 292% 


How I wish! Fundsupermart.com v12, Najibnomics to lift KLCI?
|
|
 Oct 20 2015, 02:48 PM Oct 20 2015, 02:48 PM
|
 
Senior Member
8,259 posts Joined: Sep 2009 |
QUOTE(Pink Spider @ Oct 20 2015, 02:35 PM) 0.8% x 365 = 292% How I wish! |
|
|
|
|
|
Oct 20 2015, 03:06 PM
|

Junior Member
144 posts Joined: May 2010 |
Hi All I got another question, lol... regarding about the charting
Growth/Performance chart vs Price chart As you can see at below, this is the morning star and public mutual performance/ growth chart the chart is nice and keep increase and up every years. Public Mutual performance chart 
Morning star growth chart 
but when you check on the price it doesn't seem to increase every year Morning star price chart 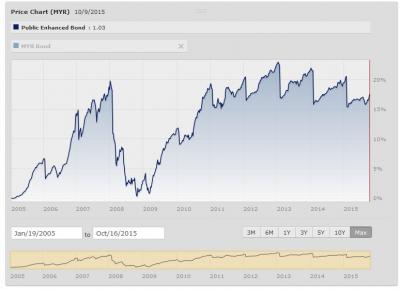
So, I wonder how the performance/ growth chart been calculate or plotting? It is taking the starting/Launch price as a standard? Meaning to say that if the price of the current fund are higher than the starting/Launch price then it consider growth? Am I right? anyone know how is the chart been calculate for the performance/ growth chart? Thanks ! |
|
|
Oct 20 2015, 03:12 PM
|
|
Senior Member
8,188 posts Joined: Apr 2013 |
QUOTE(yeah016 @ Oct 20 2015, 03:06 PM) Hi All I got another question, lol... regarding about the charting ......... but when you check on the price it doesn't seem to increase every year ........ So, I wonder how the performance/ growth chart been calculate or plotting? It is taking the starting/Launch price as a standard? Meaning to say that if the price of the current fund are higher than the starting/Launch price then it consider growth? Am I right? anyone know how is the chart been calculate for the performance/ growth chart? Thanks !  maybe the morning star chart DID not take into consideration of Dividend payout? maybe the morning star chart DID not take into consideration of Dividend payout?why not try this PM fund performance charting tool? http://www.publicmutual.com.my/application...formancenw.aspx |
|
|
Oct 20 2015, 03:19 PM
|
|
Junior Member
144 posts Joined: May 2010 |
QUOTE(yklooi @ Oct 20 2015, 03:12 PM) maybe the morning star chart DID not take into consideration of Dividend payout?why not try this PM fund performance charting tool? http://www.publicmutual.com.my/application...formancenw.aspx as you can see performance/growth up != NAV price up |
|
|
Oct 20 2015, 03:24 PM
|
|
Senior Member
8,188 posts Joined: Apr 2013 |
QUOTE(yeah016 @ Oct 20 2015, 03:19 PM) I just wonder, how the performance/ growth chart been calculate? as you can see performance/growth up != NAV price up did it show NAV price up? or did it shows the Total Returns in %? |
|
|
Oct 20 2015, 03:27 PM
|

Senior Member
3,806 posts Joined: Feb 2012 |
QUOTE(@secret@ @ Oct 20 2015, 10:21 AM) not sure if monthly DCA during a rising period is a good thing.. If you want to wait for bearish days before you buy, it could be a few months later.My KGF has been bullish these days. |
|
|
|
|
|
Oct 20 2015, 03:28 PM
|
|
Junior Member
144 posts Joined: May 2010 |
QUOTE(yklooi @ Oct 20 2015, 03:24 PM) did it show NAV price up? or did it shows the Total Returns in %?this is the morning star growth chart description, but I still not quite understand on this? how the value been calculate? will it related to NAV price? http://www.morningstar.com/InvGlossary/growth_graph.aspx |
|
|
Oct 20 2015, 03:35 PM
|
|
Senior Member
8,188 posts Joined: Apr 2013 |
QUOTE(yeah016 @ Oct 20 2015, 03:28 PM) which chart you mention? if is performance/ growth chart, it show some value, if it is the NAV price chart, of course it show the price. see blue replies...see the PM chart in post# 383....Which chart axis mention NAV? the legend mentioned..... this is the morning star growth chart description, but I still not quite understand on this? how the value been calculate? will it related to NAV price? http://www.morningstar.com/InvGlossary/growth_graph.aspx maybe as posted in post# 178 ? https://forum.lowyat.net/topic/3580942/+160 This post has been edited by yklooi: Oct 20 2015, 03:39 PM |
|
|
Oct 20 2015, 03:51 PM
|
|
Junior Member
144 posts Joined: May 2010 |
QUOTE(yklooi @ Oct 20 2015, 03:35 PM) see blue replies... ya , I think that is the total return as the blue legend show there( I can see the chart in morning star vs pb mutual are alike) , but how the total return or this chart been calculate, this is my question. |
|
|
Oct 20 2015, 03:55 PM
|
|
Senior Member
8,188 posts Joined: Apr 2013 |
QUOTE(yeah016 @ Oct 20 2015, 03:51 PM) ya , I think that is the total return as the blue legend show there( I can see the chart in morning star vs pb mutual are alike) , but how the total return or this chart been calculate, this is my question. I googled and found this...hope it helps...How to Calculate and Read Public Mutual Fund Performance Chart http://www.horlic.com/how-to-calculate-and...formance-chart/ more in google... |
|
|
Oct 20 2015, 04:00 PM
|
|
Junior Member
144 posts Joined: May 2010 |
QUOTE(yklooi @ Oct 20 2015, 03:55 PM) I googled and found this...hope it helps... yeah I also google before posting here, but this is not explaining about the performance chart.How to Calculate and Read Public Mutual Fund Performance Chart http://www.horlic.com/how-to-calculate-and...formance-chart/ more in google... |
|
|
Oct 20 2015, 04:09 PM
|
|
Senior Member
8,188 posts Joined: Apr 2013 |
QUOTE(yeah016 @ Oct 20 2015, 04:00 PM) yeah I also google before posting here, but this is not explaining about the performance chart. found this on google...hope it helps..A Guide Towards Understanding Unit Trust Performance Table http://invest-made-easy.blogspot.my/2013/0...nding-unit.html Understanding Total Return http://www.morningstar.co.za/za/news/12270...tal-return.aspx |
|
|
Oct 20 2015, 04:35 PM
|
|
Senior Member
3,806 posts Joined: Feb 2012 |
QUOTE(yklooi @ Oct 20 2015, 03:55 PM) I googled and found this...hope it helps... So the cash on cash return for PM is similar to bid-to-bid return of FSM?How to Calculate and Read Public Mutual Fund Performance Chart http://www.horlic.com/how-to-calculate-and...formance-chart/ more in google... |
|
|
|
|
|
Oct 20 2015, 04:41 PM
|
|
Senior Member
8,188 posts Joined: Apr 2013 |
QUOTE(river.sand @ Oct 20 2015, 04:35 PM) So the cash on cash return for PM is similar to bid-to-bid return of FSM? no idea.....what do you think? actually, i don't really pay much attention to it before i buy....maybe partly b'cos, they are "past" and maybe there are other factor like risk ratio that i needs to consider... |
|
|
Oct 20 2015, 05:11 PM
|

Senior Member
16,872 posts Joined: Jun 2011 |
QUOTE(river.sand @ Oct 20 2015, 04:35 PM) So the cash on cash return for PM is similar to bid-to-bid return of FSM? bid-to-bid ignores sales chargescash-on-cash...I dunno what that means |
|
|
Oct 20 2015, 05:22 PM
|
|
Senior Member
1,338 posts Joined: Sep 2012 |
QUOTE(Pink Spider @ Oct 20 2015, 05:11 PM) bid-to-bid ignores sales charges Hi Pinky, cash-on-cash...I dunno what that means  Just finished reading thread V1. Really informative and was laughing at some posts. Wanna ask you what happened to your holdings of AmDynamic bonds? And also your AmAsia Pacific Reits? |
|
|
Oct 20 2015, 05:24 PM
|
|
Senior Member
16,872 posts Joined: Jun 2011 |
QUOTE(ohcipala @ Oct 20 2015, 05:22 PM) Hi Pinky, Sold AmAsia Pac REITs becos I prefer to hold REITs direct from my stocks portfolio so that I can receive CASH dividendsJust finished reading thread V1. Really informative and was laughing at some posts. Wanna ask you what happened to your holdings of AmDynamic bonds? And also your AmAsia Pacific Reits? As for AmDynamic Bond, sold cos I prefer to have unrestricted Asian bond fund, hence shifted to RHB Asian Total Return |
|
|
Oct 20 2015, 05:26 PM
|
|
Senior Member
3,806 posts Joined: Feb 2012 |
QUOTE(Pink Spider @ Oct 20 2015, 05:11 PM) bid-to-bid ignores sales charges CoC is Public Mutual's term, also ignore sales charges.cash-on-cash...I dunno what that means |
|
|
Oct 20 2015, 05:41 PM
|
|
Senior Member
16,872 posts Joined: Jun 2011 |
QUOTE(river.sand @ Oct 20 2015, 05:26 PM) CoC is Public Mutual's term, also ignore sales charges. salahBid means the price the fund manager buy back from u Offer means the price the fund manager offer to sell to u bid to bid means ignoring sales charges BUT cash to cash SHOULD mean cash u pay to buy vs cash u get from sales I may be wrong...cos I dunno Pubic Mutual This post has been edited by Pink Spider: Oct 20 2015, 05:58 PM |
|
|
Oct 20 2015, 05:53 PM
|

Junior Member
78 posts Joined: Apr 2008 |
QUOTE(yeah016 @ Oct 20 2015, 03:51 PM) ya , I think that is the total return as the blue legend show there( I can see the chart in morning star vs pb mutual are alike) , but how the total return or this chart been calculate, this is my question. The price chart just shows the NAV price. Quick example:Month 1: Buy 10000 units @ RM1.00 Month 2: NAV is RM2.00. Value of investments become RM20000. Month 3: NAV is RM2.00. Fund declares distribution RM0.50. NAV becomes RM1.50. Value of holdings still RM20000 Month 4: NAV is RM2.00. Value of holdings become RM26666.67. Looking at the price chart for these 4 months, you'll see it go up down up back to same spot. If you look at the performance/growth chart however, it'll go up only. |
|
Topic ClosedOptions
|
| Change to: |  0.0226sec 0.0226sec
 0.19 0.19
 6 queries 6 queries
 GZIP Disabled GZIP Disabled
Time is now: 3rd December 2025 - 01:51 AM |
 Quote
Quote