

 Nov 11 2013, 01:00 PM
QUOTE(Tuten @ Nov 11 2013, 01:57 AM)
My query is if you have 3 independent variables, 1 moderating variable and 1 dependent variable in your research framework.
I'm not sure what kind of research you are currently studying, but each interacted component or element of a dynamic system will possess an input-output (or causal) relationship that can be expressed using Transfer Function. The transfer function of a linear, time-invariant, differential equation system is defined as the ratio of the Laplace transform of the output (response function) to the Laplace transform of the input (driving function) under the assumption that all initial conditions are zero.Because the analytical determination of a system's transfer function can be difficult so far as individual component values may not be known, or the internal configuration of the system may not be accessible, the frequency response of the system, from input to output, can be obtained experimentally and used to determine the transfer function.
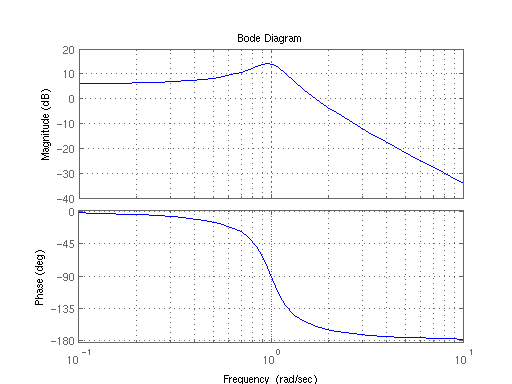
To obtain a frequency response plot experimentally, we use a sinusoidal force or signal generator at the input to the system and measure the output steady-state sinusoid amplitude and phase angle (see Bode plots). Repeating this process at a number of frequencies yields data for a frequency response plot. Once the frequency response is obtained, the transfer function of the system can be estimated from the break frequencies and slopes.
Bode plots are a convenient presentation of the frequency response data for the purpose of estimating the transfer function. These plots allow parts of the transfer function to be determined and extracted, leading the way to further refinements to find the remaining parts of the transfer function. For more information on obtaining transfer functions experimentally, read related topics like “model identification” or “system identification.”
 Quote
Quote
 0.0155sec
 0.30
0.30
 6 queries
 GZIP Disabled