QUOTE(MichalD @ Jan 7 2020, 03:03 AM)
Hello! Hmmmm you power grid voltage 215 VAC...strange.
Not. I have a power grid voltage of 220VAC +/- 5% in my mill, but I use a 220 / 220VAC isolation transformer here for debugging - for galvanic isolation from the network (for electrical safety when accidentally touching the high-voltage parts of the device), the output of which is, as I noticed yesterday , the voltage turned out to be slightly lower: 215VAC. It is not important for such work.
I also use the optional isolation transformer 220 / 220VAC for galvanic isolation from the network of my oscilloscope. This is not necessary if there is already an isolation transformer in the power circuit of the device being debugged.
QUOTE
try to check VR1, TH1, R1 and all caps at the input.
Thanks!

Of course, I will check all these elements, and still other possible reasons ...
QUOTE
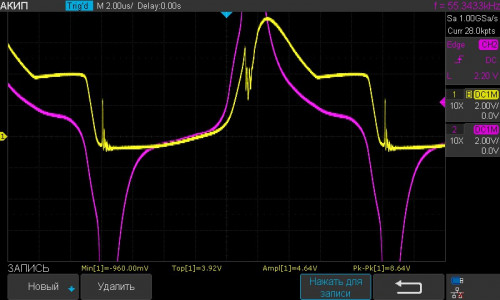
Yes i can retake the waweforms again:
Do you want from me to oscilogram for:
T1 1(4) - Anode of D22 and Q3 G - Q3 S...not Q2?
T1 1(4) is the same as Q2 S.
Not. This is not necessary now. Maybe later, if you need to more subtly understand the operation of the device.
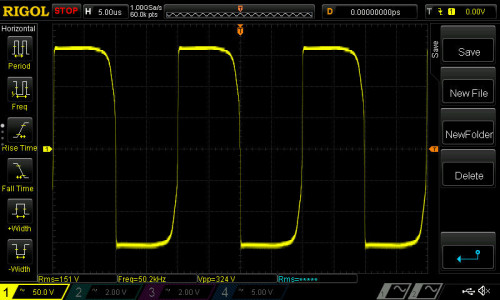
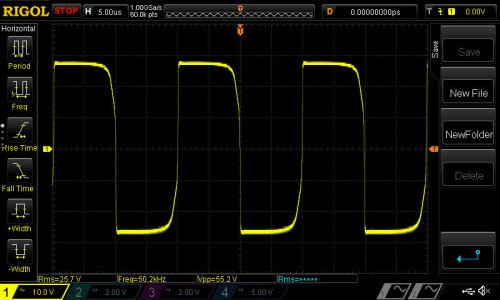
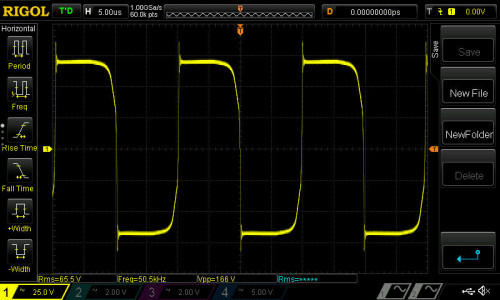
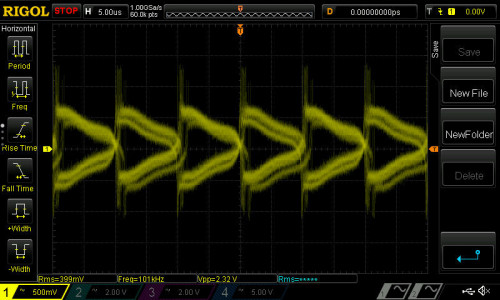
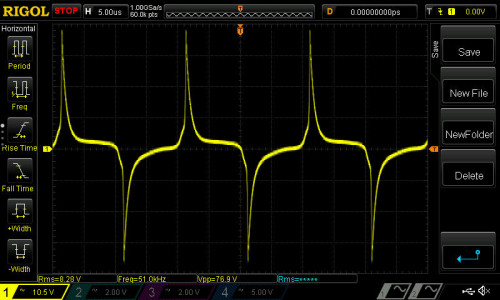
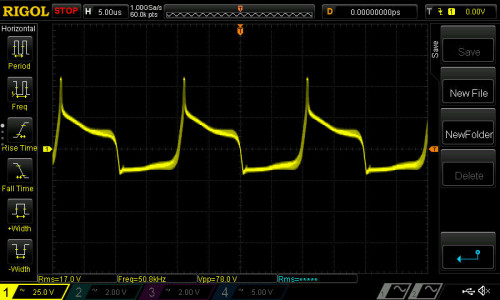
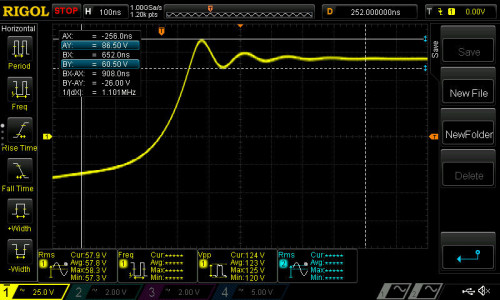
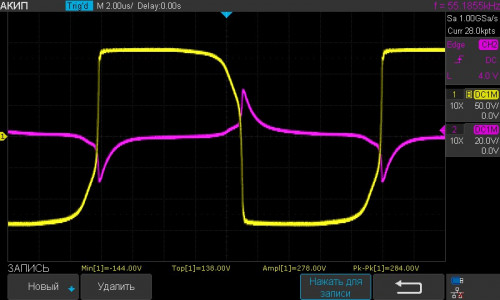
The following oscillograms are much more interesting to me now:
1. Between the source (S) Q2 and the anode (G) Q2.
2. Between the source (S) Q2 and the gate (G) Q2.
AND
On Q2 it is more interesting than on Q3 because in this case there will be no influence of the trigger circuit D6, D7 and C54 on the waveform.
QUOTE
if i can connect to scope input channel 1 dif. probe + to Q2 G and GND to T1 1(4, Q2 S) and to input channel 2 passive probe (supplied with the scope) + anode of D23 and GND to T1 1(4, Q2 S) in the real time and measure both signals at once?
Understand how perfect the differential inputs (or external differential probes) of your oscilloscope are, you need to read the documentation for them. Now there is no need to measure waveforms at different points of the device at the same time - just use one channel!
Just in case for the future: please measure with a good tester the resistance between the terminals of your dif. probe. In all four possible options. If the tester shows a short circuit in at least one of the measurement options (or even a resistance of hundreds of kilo-ohms), then these dif. probe cannot simultaneously record oscillograms in different — not having a common point — device locations !! In addition, when measuring in devices with high voltages, you must make sure in the manual that your dif. probe withstand this voltage difference !!
If you look carefully, the oscillograms that I post here to explain my thoughts are all necessarily taken with respect to the same common point for both channels, because I do not have real differential inputs at my oscilloscope (and this sometimes makes it very difficult understanding of the operation of the entire device. I have to somehow get out

)
QUOTE
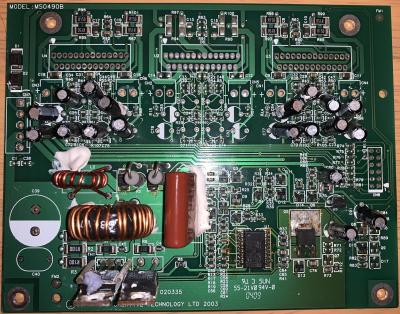
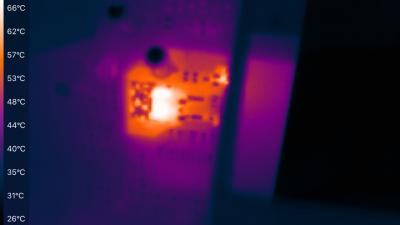
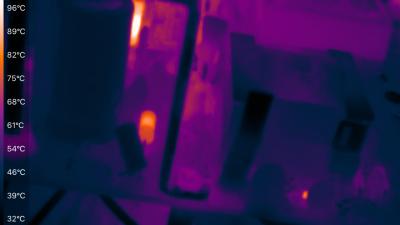
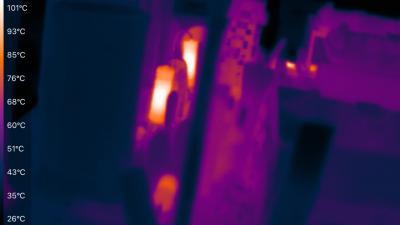
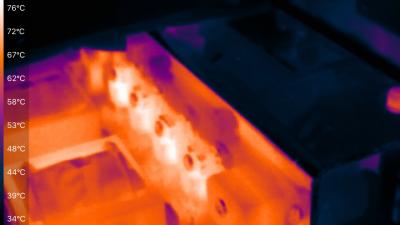
By the way i tooked som thermal images of the PSU, and the mosfets are not the hottest parts. Hottest are some resistors near D6, 7 and the standing ones behing the 4 big caps. Mosfets are around 70 °C. Pictures taken after one hour in idle mode and the internals of the subwoofer were in open air.
This is very interesting for me! Especially the description of the state of the measurement! )))
Unfortunately, I am not as "armed" as you are, and I do not have a thermal imager. Therefore, I can not lay out my thermograms. I have to focus only on my sensations of temperatures in the device (though they are very close to yours).
QUOTE
Tomorrow afternoon i will go outside of my house for a week so i can take the oscilograms only during next weekend...
I will be very glad if you manage to take for me those two oscillograms from the beginning of this message of mine. But please do not worry about the rest !!!


 Dec 16 2019, 02:53 AM

 Quote
Quote


 0.1062sec
 0.46
0.46
 6 queries
 GZIP Disabled